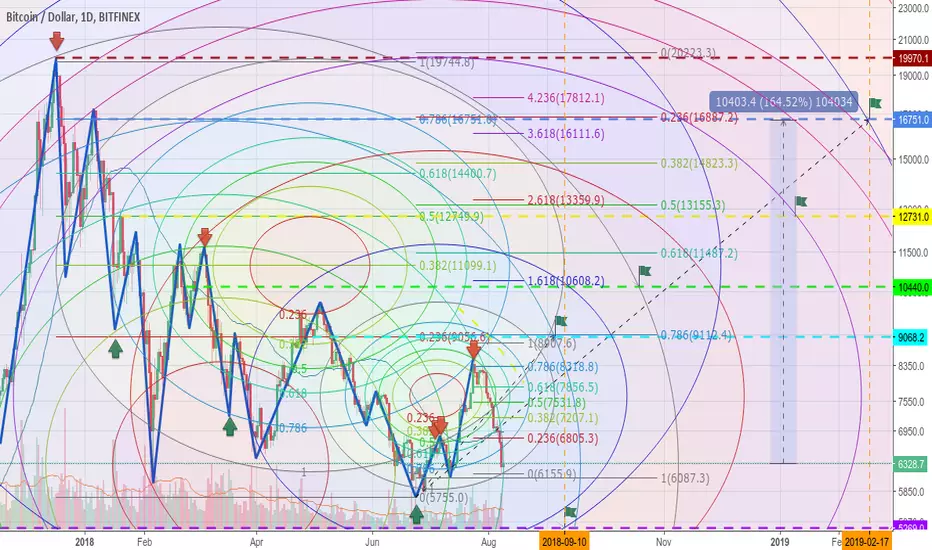
Today update we are going back to the daily TF where the bigger picture is folding. Our Bear target is the same for the last month, also mostly our bull ones. This perspective provides reasonable and usually very precise timing to take decisions on your risk management.
If you can't really understand all the curves, just look at the green flags holding possible bear and bull targets with expected timing.
Side note, look how we are about to cross the big green curve holding the bulls, but failing to do so will hammer it down to the bear target very fast !
If you can't really understand all the curves, just look at the green flags holding possible bear and bull targets with expected timing.
Side note, look how we are about to cross the big green curve holding the bulls, but failing to do so will hammer it down to the bear target very fast !
Note
After hitting the standard fib at 1(6087.3) looks like some recovery is on progress. As pointed out several times, market will be fully bullish only above 9k with the current low at 5.7. If a renewed low occur I would need to update that milestone. Between 5.7 and 9k is a gray area !Note
Bears dominating with more shorts than longs on the margin market, it is lower than 1. For spot market bulls needs at least to get past 6.5k:Note
Bulls break up:Note
Bulls very weak on lower TF failing to stay above 6.5k, while on margin market bears are too much saturated so market is working on a small range accumulating for the next big move:Note
Market is back above 6.5k hitting the 0.382 std fib precisely 6900 and also touching the 0.786 circle fib (blue curve) precisely another test from the upside to 6.5k is probable:Note
A reversal is going on on the margin market and pushing bears away for a while, the nearish important point on the 4H TF is the 0.5 std fib at 7.2K:Note
Not too much to add, market still boring and running in a range:Note
0.5 std fib reached:Note
Strong resistence ahead:Related publications
Disclaimer
The information and publications are not meant to be, and do not constitute, financial, investment, trading, or other types of advice or recommendations supplied or endorsed by TradingView. Read more in the Terms of Use.
Related publications
Disclaimer
The information and publications are not meant to be, and do not constitute, financial, investment, trading, or other types of advice or recommendations supplied or endorsed by TradingView. Read more in the Terms of Use.