The
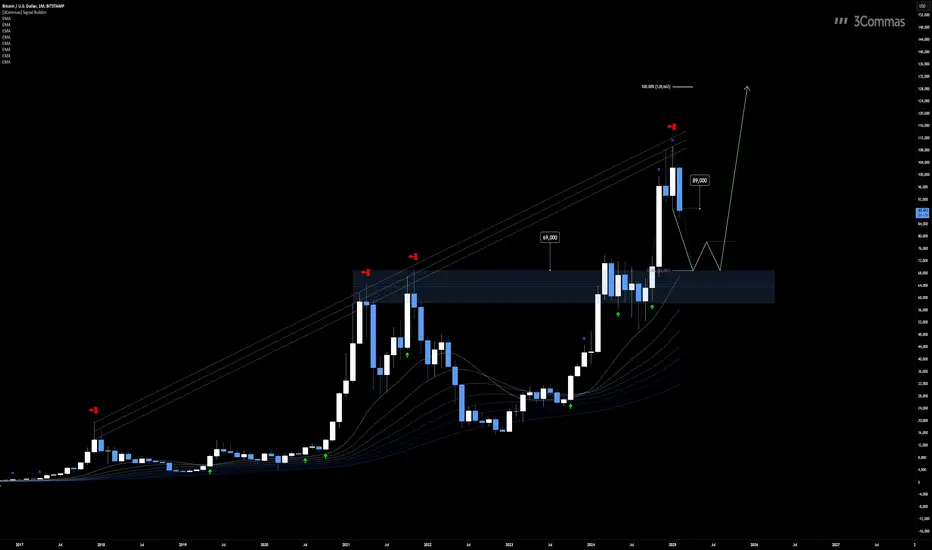
Historically, Bitcoin has shown a tendency to retrace back to the trendline, and the current structure suggests this pattern may repeat. A bounce from the $69,000 zone could present an attractive long-term buying opportunity. Traders may look for either an immediate reaction at this level or wait for confirmation by breaking the next swing high after the rebound.
Despite the short-term risks, the monthly EMA ribbon remains bullish, with the price holding above it, reinforcing the long-term uptrend. If the bullish scenario plays out, the next significant target is projected at $128,000, derived from the Fibonacci extension of the previous bullish cycle. This level aligns with the long-term upward trajectory and could be the next destination if Bitcoin regains momentum.
👨🏻💻💭 What’s your game plan? Will BTC hold above $89,000 and target $128,000, or are we heading for a retest of $69,000 before the next leg up? Share your thoughts below and let’s discuss!
__
The information and publications within the 3Commas TradingView account are not meant to be and do not constitute financial, investment, trading, or other types of advice or recommendations supplied or endorsed by 3Commas and any of the parties acting on behalf of 3Commas, including its employees, contractors, ambassadors, etc.
🤖 It's time to trade smarter with 3Commas!!
📣 Sign up to get up to 25% off
👉 bit.ly/TradingView3Commas
📣 Sign up to get up to 25% off
👉 bit.ly/TradingView3Commas
Disclaimer
The information and publications are not meant to be, and do not constitute, financial, investment, trading, or other types of advice or recommendations supplied or endorsed by TradingView. Read more in the Terms of Use.