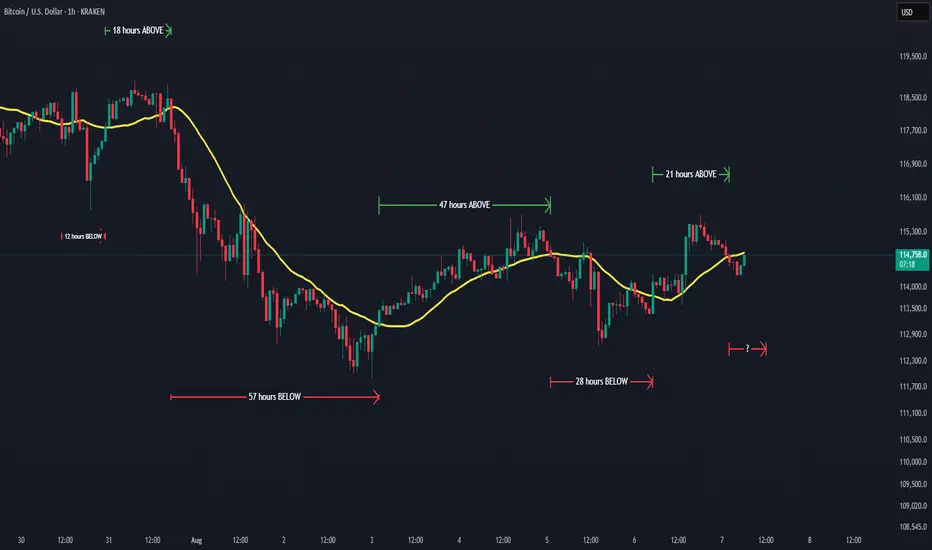
Hourly chart using the 21 SMA.
The yellow moving average is the key to figuring out if Bitcoin will be rising or falling in the next few hours.
This chart helps to illustrates when an uptrend or downtrend is about to begin or end.
When price breaks ABOVE the yellow line, Bitcoin should have a RISE in price for approximately 12-60 hours.
And when price breaks BELOW the yellow line, Bitcoin should have a FALL in price for about 12-60 hours.
Traders may think this is a lame chart, but it comes in handy when markets are down and you're wondering when is the price ever going back up.
I first look at the number of hours price action has been under the yellow line.
I feel between 16-20 hours is the norm.
Then I watch for a break and candle close above the 21 SMA.
This usually indicates the trend maybe reversing to the upside.
And yes sometimes there's fake outs.
And the same is true when Bitcoin is rallying.
When price falls and closes a candle below the yellow line, there's a possibility Bitcoin will start experiencing a downtrend.
Psycologically rise in prices don't feel like they last that long.
But if you look at this chart, price staying above the 21 SMA is about equal to the number of hours price stays below the 21 SMA.
Disclaimer
The information and publications are not meant to be, and do not constitute, financial, investment, trading, or other types of advice or recommendations supplied or endorsed by TradingView. Read more in the Terms of Use.
Disclaimer
The information and publications are not meant to be, and do not constitute, financial, investment, trading, or other types of advice or recommendations supplied or endorsed by TradingView. Read more in the Terms of Use.