✅ Chart Analysis (2h Timeframe)
MY using Ichimoku Cloud, support/resistance zones, and trend lines.
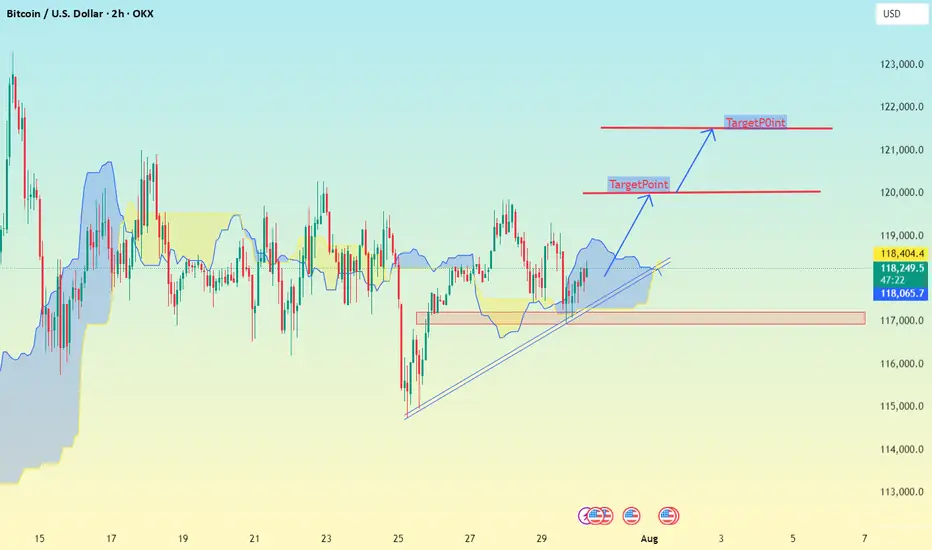
Price is currently around 118,319 USD.
It has broken out of the Ichimoku cloud and is respecting the trendline support, indicating bullish momentum.
---
🎯 Upside Target Levels
🔵 Target 1:
Level: ~120,000 USD
Reason: Horizontal resistance (clearly marked)
Action: Minor profit-taking or partial exit
🔵 Target 2 (Main):
Level: ~122,000 USD
Reason: Second resistance zone & projected move from breakout
Action: Ideal full target zone
---
🔻 Support & Invalidations
🟡 Immediate Support Zone:
Levels:
118,404
118,296
118,065
These are dynamic Ichimoku & short-term support levels
MY using Ichimoku Cloud, support/resistance zones, and trend lines.
Price is currently around 118,319 USD.
It has broken out of the Ichimoku cloud and is respecting the trendline support, indicating bullish momentum.
---
🎯 Upside Target Levels
🔵 Target 1:
Level: ~120,000 USD
Reason: Horizontal resistance (clearly marked)
Action: Minor profit-taking or partial exit
🔵 Target 2 (Main):
Level: ~122,000 USD
Reason: Second resistance zone & projected move from breakout
Action: Ideal full target zone
---
🔻 Support & Invalidations
🟡 Immediate Support Zone:
Levels:
118,404
118,296
118,065
These are dynamic Ichimoku & short-term support levels
t.me/RSI_Trading_Point4
Forex, gold and crypto signal's with detailed analysis & get consistent results..
t.me/Gold_Analysis_Experiment
Gold signal's with proper TP & SL for high profits opportunities..
Forex, gold and crypto signal's with detailed analysis & get consistent results..
t.me/Gold_Analysis_Experiment
Gold signal's with proper TP & SL for high profits opportunities..
Disclaimer
The information and publications are not meant to be, and do not constitute, financial, investment, trading, or other types of advice or recommendations supplied or endorsed by TradingView. Read more in the Terms of Use.