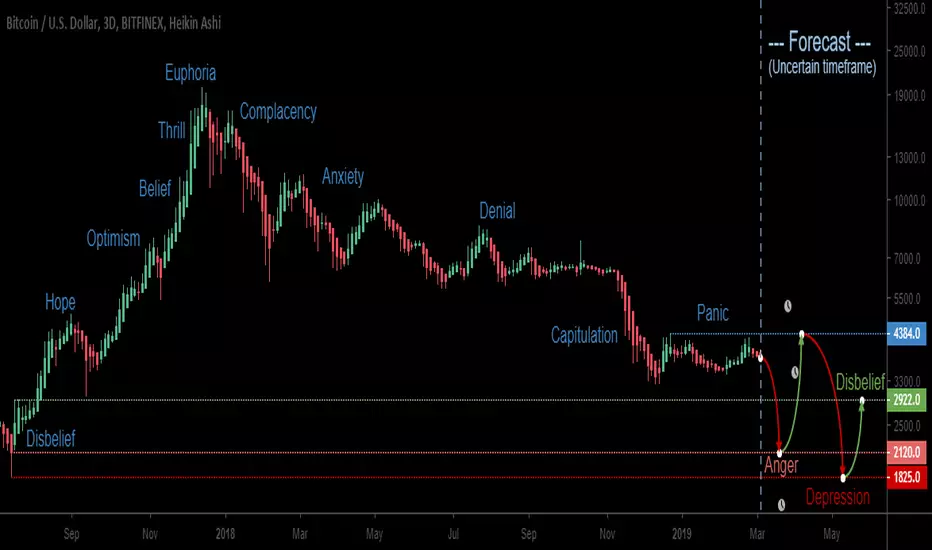
Simple reminder of the big picture.
Implies this market cycle is unfolding much slower than the previous one.
The possibility remains that BTC could be following a Bullish pattern similar to NASDAQ circa 2001 - see linked chart.
Implies this market cycle is unfolding much slower than the previous one.
The possibility remains that BTC could be following a Bullish pattern similar to NASDAQ circa 2001 - see linked chart.
Note
Same info spaced further apart for better visualization.Note
Chart of referenced BTC comparison with NASDAQ circa 2001.Note
Broader view with some updated targets.Note
In latest chart, the yellow and red vertical lines represent bullish possibilities for Anger and Depression. Though, to be valid requires repositioning the other psychological indicators.Note
Were this BTC and my below SPX (that pokes fun at Captain Marvel) ideas to play out then BTC and SPX would be similarly priced.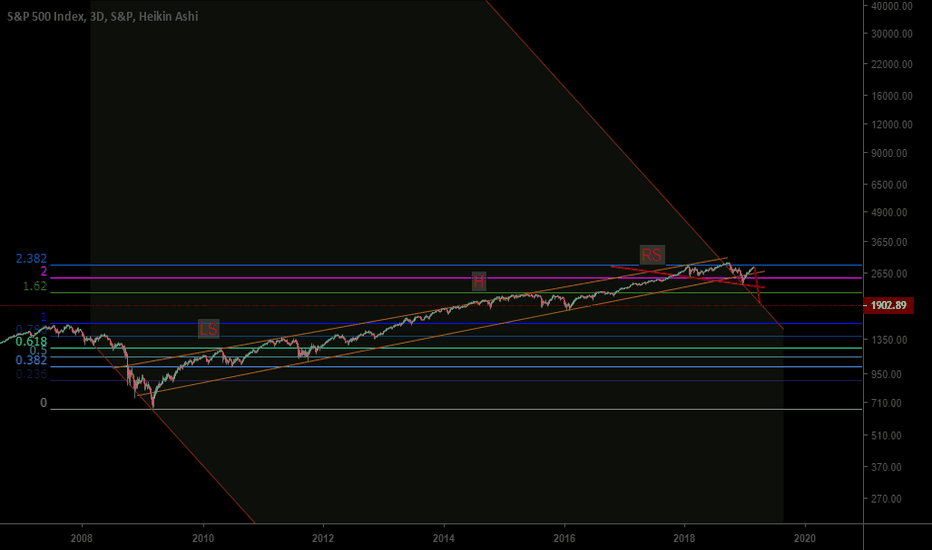
Note
Changed my attitude on BTC market. Looks like the Bull market is ready for action. Updated idea below.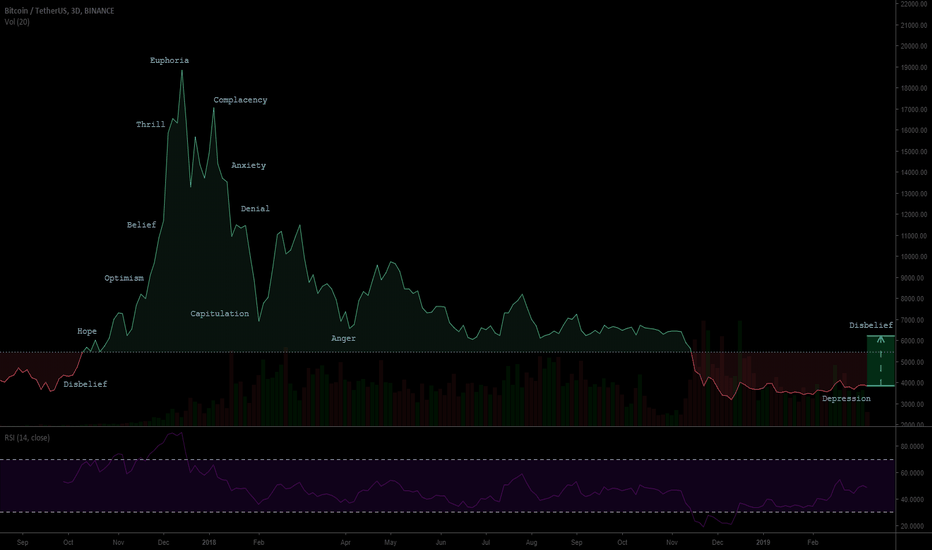
Related publications
Disclaimer
The information and publications are not meant to be, and do not constitute, financial, investment, trading, or other types of advice or recommendations supplied or endorsed by TradingView. Read more in the Terms of Use.
Related publications
Disclaimer
The information and publications are not meant to be, and do not constitute, financial, investment, trading, or other types of advice or recommendations supplied or endorsed by TradingView. Read more in the Terms of Use.