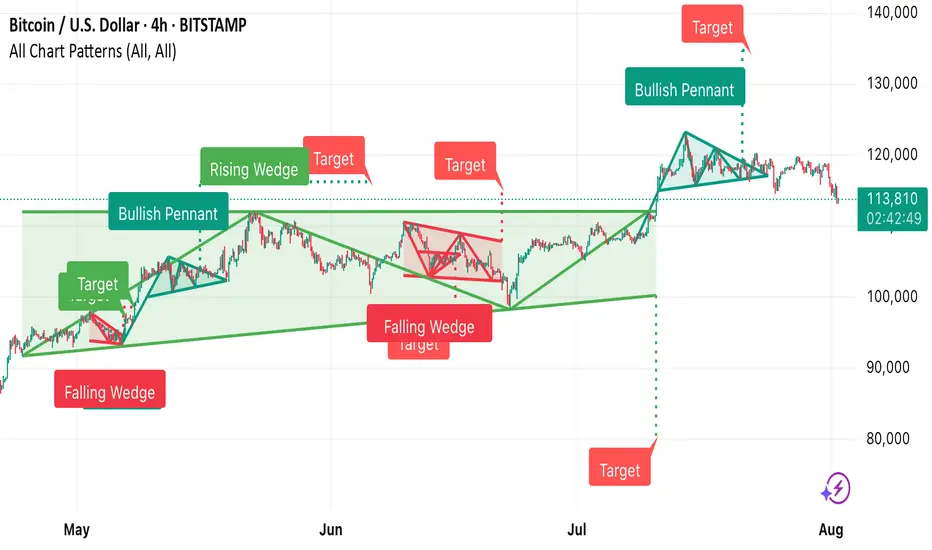
• Falling Wedge (early May) → Bullish breakout, target achieved.
• Bullish Pennant → Strong upward continuation.
• Rising Wedge (June) → Bearish breakdown, target met.
• Falling Wedge (mid-June) → Bullish breakout, target achieved.
• Bullish Pennant (late July) → Upward move toward the 140,000 target zone.
Currently, BTC is trading around 113,829, below recent highs, and near the dotted horizontal support zone from the last breakout.
𝙇𝙚𝙩'𝙨 𝙎𝙩𝙖𝙧𝙩 𝙔𝙤𝙪𝙧 𝙟𝙤𝙪𝙧𝙣𝙚𝙮 𝙒𝙞𝙩𝙝 𝙎𝙖𝙛𝙚 𝙏𝙧𝙖𝙙𝙞𝙣𝙜 𝙈𝙖𝙨𝙩𝙚𝙧 𝙡𝙚𝙫𝙚𝙡 𝙏𝙧𝙖𝙙𝙞𝙣g
Disclaimer
The information and publications are not meant to be, and do not constitute, financial, investment, trading, or other types of advice or recommendations supplied or endorsed by TradingView. Read more in the Terms of Use.
𝙇𝙚𝙩'𝙨 𝙎𝙩𝙖𝙧𝙩 𝙔𝙤𝙪𝙧 𝙟𝙤𝙪𝙧𝙣𝙚𝙮 𝙒𝙞𝙩𝙝 𝙎𝙖𝙛𝙚 𝙏𝙧𝙖𝙙𝙞𝙣𝙜 𝙈𝙖𝙨𝙩𝙚𝙧 𝙡𝙚𝙫𝙚𝙡 𝙏𝙧𝙖𝙙𝙞𝙣g
Disclaimer
The information and publications are not meant to be, and do not constitute, financial, investment, trading, or other types of advice or recommendations supplied or endorsed by TradingView. Read more in the Terms of Use.