market is respecting key support/resistance or channel boundaries. These points often become decision zones where big moves occur.
Signs this could be a fakeout:
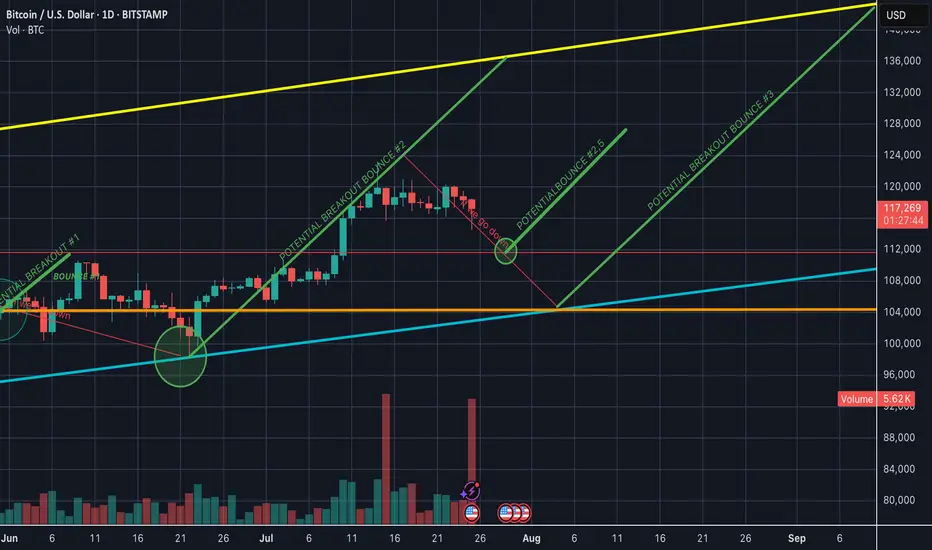
If BTC recently broke a trendline with low volume, it smells like a trap move — a liquidity grab.
If it’s testing support again after failing to rally, and volume is increasing on red candles, a leg down is possible.
However, macro trend is still up unless we lose a major higher low (say, sub-$60k or sub-$56k depending on your chart).
Signs this could be a fakeout:
- BTC wicks above a resistance or below a support with little follow-through
- Volume spikes only on the wick, then dies quickly
- Price reverses back into the range soon after breaking it
If BTC recently broke a trendline with low volume, it smells like a trap move — a liquidity grab.
If it’s testing support again after failing to rally, and volume is increasing on red candles, a leg down is possible.
However, macro trend is still up unless we lose a major higher low (say, sub-$60k or sub-$56k depending on your chart).
Disclaimer
The information and publications are not meant to be, and do not constitute, financial, investment, trading, or other types of advice or recommendations supplied or endorsed by TradingView. Read more in the Terms of Use.
Disclaimer
The information and publications are not meant to be, and do not constitute, financial, investment, trading, or other types of advice or recommendations supplied or endorsed by TradingView. Read more in the Terms of Use.