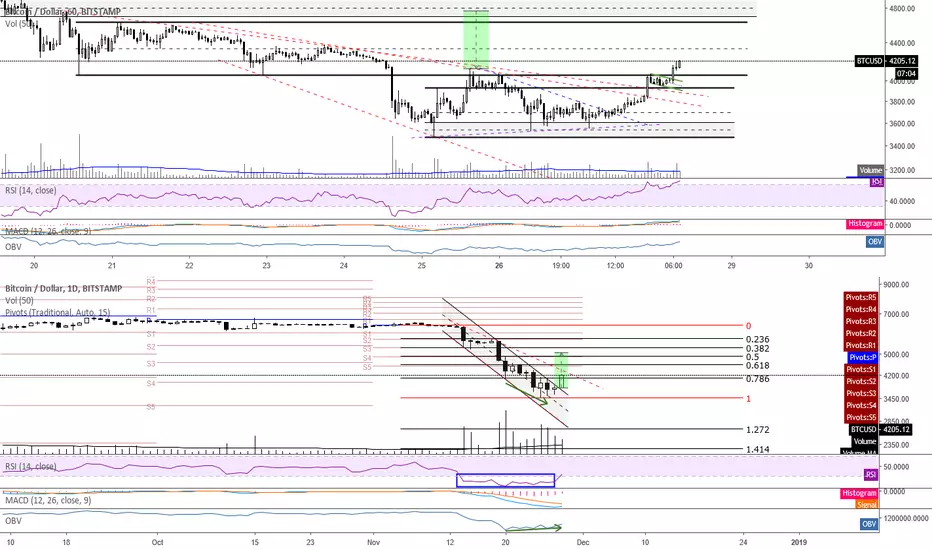
Good morning, traders. Bitcoin showed some bullishness overnight which shouldn't have surprised anyone. Looking at the 1D, we can see bullish divergence printed in RSI between 11/24 and 11/26-11/27. This has led to almost the largest daily move up since July. A few hundred more dollars of appreciation before the daily close would cement this. The question now is whether this is the beginning of a reversal or if it's just a brief reprieve before a trip to $3000. I realize many people are calling for a quick trip to $4300 or even $4800 followed by a drop down to below $3000, but if we hit those targets quickly, especially the latter, then such a strong move back down wouldn't support the bullish divergence narrative. Because this divergence happened on the 1D TF, we should expect more than a day or two of upward momentum. That doesn't mean price can't go down, just that as traders we should always recognize patterns and indicators that are playing out and their general expected relation to price movement.
As I mentioned during yesterday morning's live stream, we need to see a close above the swing high at $4120 to even begin thinking about a reversal. That marks the confirmation level for the double bottom and will set up a target of the $4760 area which gets price right into supply. I don't believe we can see price initially pushing through supply at $4700-$4900 unless we happen to hit a strong pocket of shorts right below it. The expectation is usually to hit supply, drop back, and then push through on the second or third attempt, depending on just how deep the supply runs. This double bottom isn't as significant in the overall price movement of 2018 as the bottoms are very close together, but in terms of a shorter TF, it does provide fuel for a bounce at the very least and that's what we are currently experiencing.
It is important to note that last night's move pulled price through the descending channel's resistance which has been present since the beginning of the drop, itself a bullish move and possible signal of a reversal. Further continued bullishness by the close of the 1W in four days would print tweezer bottoms which is a reversal signal. As an aside, price also broke out of the 1D symmetrical triangle. I'm not giving that pattern a lot of weight due to its very short printing, but the price target based on the size of that triangle would be around $4575. A push toward that level would align with resistance of the descending broadening wedge. This would provide a likely place for price to retreat, so any push through and close above it gives a possible reversal a lot more teeth. Finally, 1D RSI has finally moved out of oversold, which it has been in for two weeks, and is currently sitting at 30.34. The candle closing at this level or higher would be bullish in the short term, at the very least.
I mentioned yesterday that I am expecting some resistance around $4340 and, today, Bitstamp is showing noticeable supply at $4280 and strong supply at $4350. This aligns with the overlapping 1D supply. I also discussed how OBV was looking weak on that TF but a move up through the end of the day would change that, and that's what happened. Daily OBV continues to print higher lows and highs supporting the current price appreciation narrative. None of what I said guarantees that a reversal from the lows is in progress, but it does start to build a case for it. Traders need to remain aware and employ strong risk management as always. I will be taking a closer look at these patterns and targets during this morning's live stream.
Remember, you can always click on the "share" button in the lower right hand of the screen, under the chart, and then click on "Make it mine" from the popup menu in order to get a live version of the chart that you can explore on your own.
Disclaimer
The information and publications are not meant to be, and do not constitute, financial, investment, trading, or other types of advice or recommendations supplied or endorsed by TradingView. Read more in the Terms of Use.
Disclaimer
The information and publications are not meant to be, and do not constitute, financial, investment, trading, or other types of advice or recommendations supplied or endorsed by TradingView. Read more in the Terms of Use.