I sharpened the math & changed the Elliot numbers...added in some more notes. Visually a cleaner chart to run was one goal. There's a bounce coming. Opinion: Short overall with a healthy bounce at some point.
Note
checking another impulse set... seems to work still .. BTC 1 hourNote
Long term (#1) RSI 3 hour...the indicator doesn't have to go to the red....At the same time it has not reached the red line. Remains a force when I look at the Long term (#2) Daily MAC'd actively heading negative now (see macd: chart #'s), what boost downward combination ?? Note
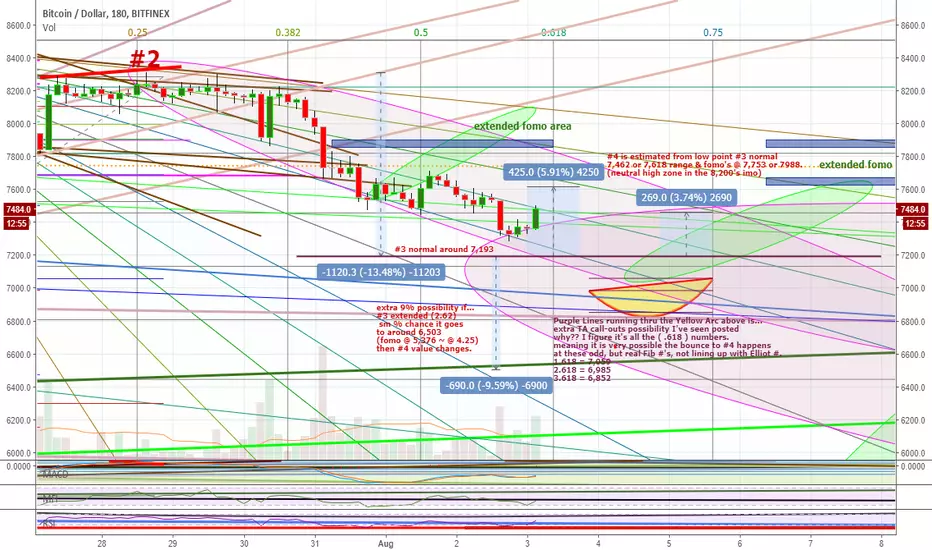
if it's #4 time... here's some "percentage targets" Note
Note
The 1 Day... keeps me in the short trade....here's Daily RSI and 3 hour Note
BTC 30 min Chart. What about those odd gaps that randomly happen? Note
The Gap is now gone.........? Note
Indicators are now low...comparable chart above .. BTC 30 min. Note
3 hour RSI has almost hit the red line...I feel it might be the last attempted try before a larger move upwards..5% - 10% .. maybe to form #4...maybe we're in a bigger ABC....I still think an extended #3 leg approx.. 6,503 which we are at now, but hit low point approx. 6,360. hyperextended #3 leg = an insane drop to 5,376, before leg #4... which then make #5 leg easily go into the low 4,000's... a 4.8k low, that is very possible. I do not think #3 goes that low before a recognizable bounce #4 of at least 5%. Disclaimer
The information and publications are not meant to be, and do not constitute, financial, investment, trading, or other types of advice or recommendations supplied or endorsed by TradingView. Read more in the Terms of Use.
Disclaimer
The information and publications are not meant to be, and do not constitute, financial, investment, trading, or other types of advice or recommendations supplied or endorsed by TradingView. Read more in the Terms of Use.