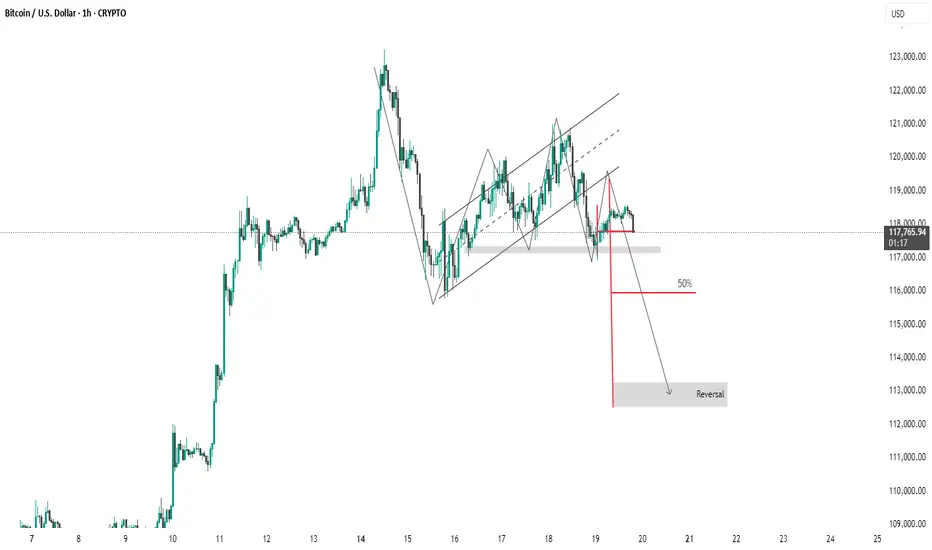
This 1-hour Bitcoin (BTC/USD) chart shows a bearish setup following a breakdown from a rising channel. Price is currently testing a support zone around $117,000. A potential continuation move is projected down toward the $113,000–$114,000 area, where a reversal is anticipated. The red arrow indicates the expected bearish move, supported by prior structure and trend shift.
thanking you
thanking you
Related publications
Disclaimer
The information and publications are not meant to be, and do not constitute, financial, investment, trading, or other types of advice or recommendations supplied or endorsed by TradingView. Read more in the Terms of Use.
Related publications
Disclaimer
The information and publications are not meant to be, and do not constitute, financial, investment, trading, or other types of advice or recommendations supplied or endorsed by TradingView. Read more in the Terms of Use.