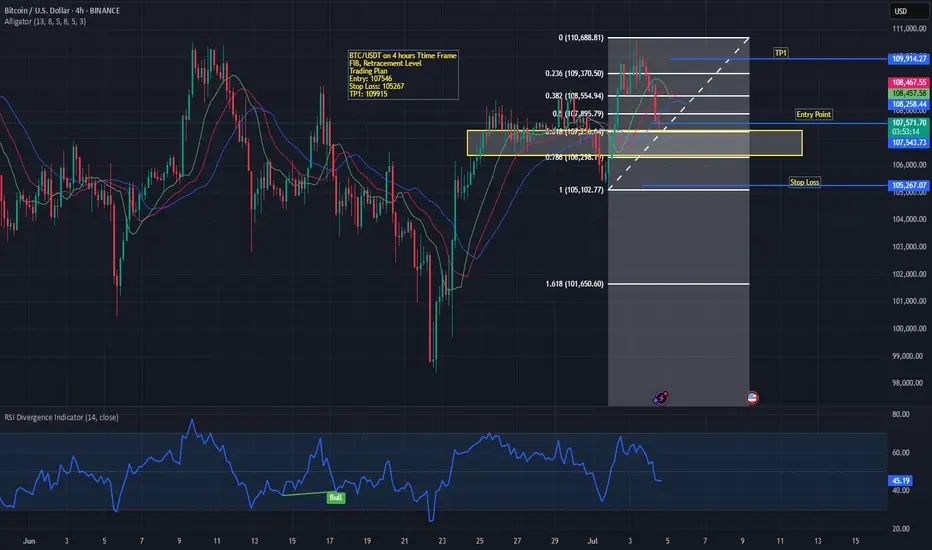
The price is currently retracing after a recent upward move and is testing the 38.2% Fibonacci level (≈107,805).
The entry zone is defined around 107,546, marked in yellow, suggesting a possible support area where buyers may step in.
The stop loss is placed slightly below at 105,267, around the 78.6% Fibonacci retracement level, to manage risk if the market breaks this zone.
The take-profit (TP1) target is set near 109,867, close to the previous high and aligning with the 0.236 Fib level (≈109,370).
📉 Indicators & Patterns
EMAs are converging, with price slightly under them, showing possible weakness but not a confirmed downtrend yet.
RSI (Relative Strength Index) at the bottom is around 45, signaling neutral momentum—neither overbought nor oversold.
A bullish divergence was marked earlier on RSI, which supported the previous price rise.
📈 Trading Plan Summary
Entry: 107,546
Stop Loss: 105,267
TP1: 109,867
Bias: Watching for a bullish reversal from the yellow support zone.
If price fails to hold above 106,296, it may head toward 105,102 and the 1.618 Fib extension (101,650).
This setup suggests a high-risk, reward potential if price bounces in the support zone, but caution is advised as RSI and EMAs currently show mixed signals.
Disclaimer
The information and publications are not meant to be, and do not constitute, financial, investment, trading, or other types of advice or recommendations supplied or endorsed by TradingView. Read more in the Terms of Use.
Disclaimer
The information and publications are not meant to be, and do not constitute, financial, investment, trading, or other types of advice or recommendations supplied or endorsed by TradingView. Read more in the Terms of Use.