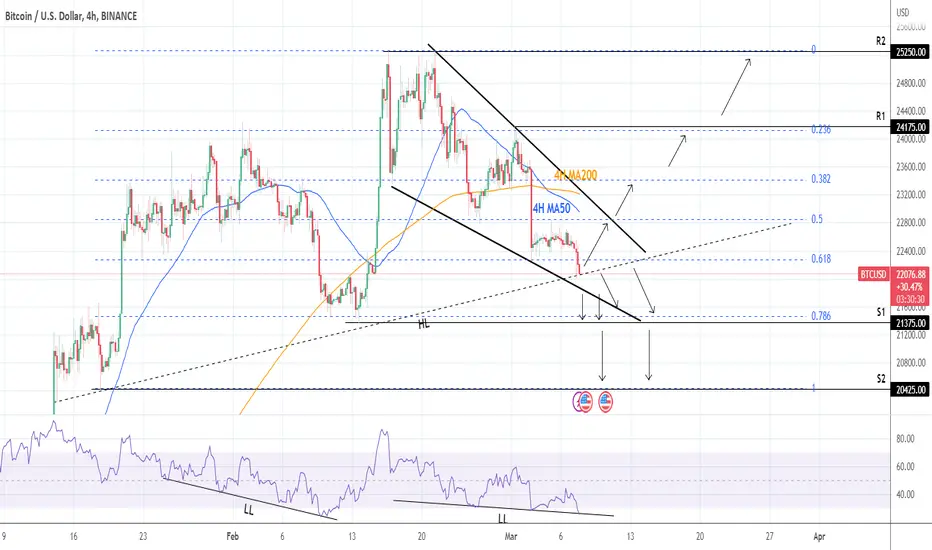
Bitcoin is now bearish on the 1D time frame (RSI = 40.648, MACD = -188.700, ADX = 20.767) as it has completed 3 weeks trading inside a Falling Wedge pattern that crossed today under the 0.618 Fibonacci retracement level. This Wedge is guiding gradually the price to the lower Supports of S1 (21,375) and S2 (20,425) and will continue to do so unless it breaks to the upside.
The chart shows that the Fibonacci levels form very accurate Supports and Resitances. We will be buy each time a candle closes over a Fibonacci level and target the one above. Likewise, we will sell every time a candle close below a Fibonacci level and target the lower one (so far only Fib 0.786 and eventually 1.0 the bottom are left to the downside).
## If you like our free content follow our profile to get more daily ideas. ##
## Comments and likes are greatly appreciated. ##
Telegram: t.me/investingscope
investingscope.com
Over 65% accuracy on Private Signals Channel.
Over 15% return monthly on our Account Management Plan.
Account RECOVERY services.
Free Channel: t.me/investingscopeofficial
investingscope.com
Over 65% accuracy on Private Signals Channel.
Over 15% return monthly on our Account Management Plan.
Account RECOVERY services.
Free Channel: t.me/investingscopeofficial
Disclaimer
The information and publications are not meant to be, and do not constitute, financial, investment, trading, or other types of advice or recommendations supplied or endorsed by TradingView. Read more in the Terms of Use.