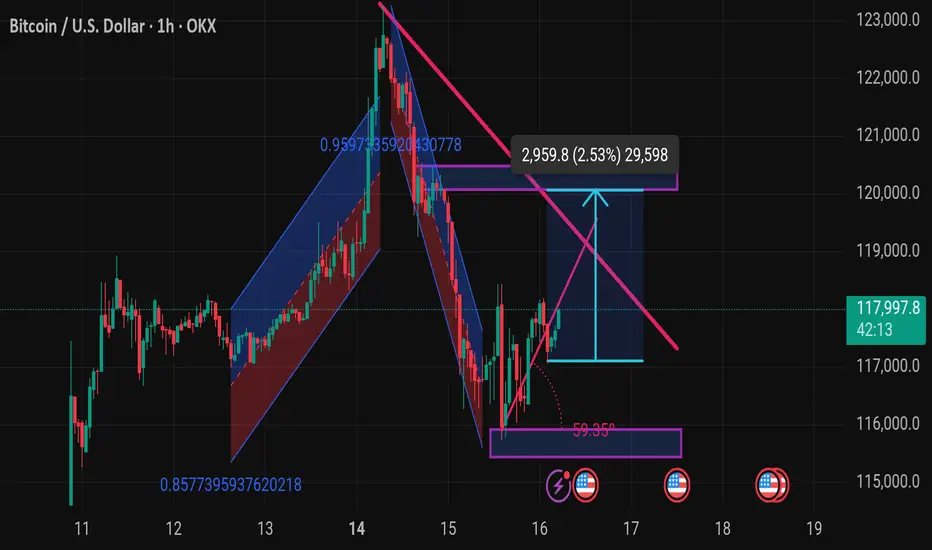
This Bitcoin (BTC/USD) chart from TradingView illustrates a technical analysis on the 1-hour timeframe. Here's a breakdown of the key elements and possible implications:
---
🔍 Chart Overview:
Current Price: $117,997.8
Timeframe: 1-hour candles
Exchange: OKX
Date/Time: July 16, 2025, 05:16 UTC
---
🧠 Key Technical Patterns & Indicators:
1. Descending Triangle Breakout Setup:
A descending resistance line (in pink) is converging with a horizontal support level (around $116,000–$117,000).
The price appears to be testing the upper boundary, indicating a potential breakout.
2. Target Measurement:
The blue arrow pointing upward suggests a measured move after a breakout.
Target Price: ~ $120,957.8 (approx. 2.53% move or +2,959.8 points from breakout level)
3. Support Zone:
Strong horizontal support zone marked in purple near $116,000.
This zone has held despite a sharp dip, indicating buyer interest.
4. Previous Trend Channels:
Blue and red channels represent bullish and bearish trends.
Recent bearish
---
🔍 Chart Overview:
Current Price: $117,997.8
Timeframe: 1-hour candles
Exchange: OKX
Date/Time: July 16, 2025, 05:16 UTC
---
🧠 Key Technical Patterns & Indicators:
1. Descending Triangle Breakout Setup:
A descending resistance line (in pink) is converging with a horizontal support level (around $116,000–$117,000).
The price appears to be testing the upper boundary, indicating a potential breakout.
2. Target Measurement:
The blue arrow pointing upward suggests a measured move after a breakout.
Target Price: ~ $120,957.8 (approx. 2.53% move or +2,959.8 points from breakout level)
3. Support Zone:
Strong horizontal support zone marked in purple near $116,000.
This zone has held despite a sharp dip, indicating buyer interest.
4. Previous Trend Channels:
Blue and red channels represent bullish and bearish trends.
Recent bearish
🎯XAUUSD GOLD Daily 8-9 Free Signals🚀 World Best community Join Here ✅
💫XAUUSD
💫BTC
💫EURUSD
For Signals Telegram channel
⬇️⬇️⬇️⬇️⬇️⬇️⬇️⬇️⬇️⬇️⬇️⬇️⬇️
t.me/technicaltrader10
💫XAUUSD
💫BTC
💫EURUSD
For Signals Telegram channel
⬇️⬇️⬇️⬇️⬇️⬇️⬇️⬇️⬇️⬇️⬇️⬇️⬇️
t.me/technicaltrader10
Disclaimer
The information and publications are not meant to be, and do not constitute, financial, investment, trading, or other types of advice or recommendations supplied or endorsed by TradingView. Read more in the Terms of Use.