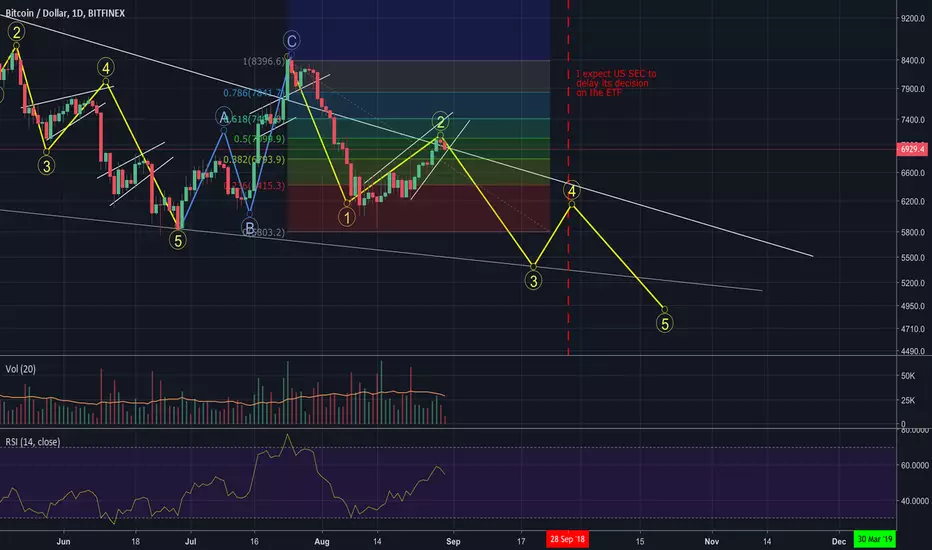
Two days ago I published a bearish scenario on BTC already.
Here is a new one even more bearish.
Here is a new one even more bearish.
Note
I know that a lot of crypto traders use different parameters (like 20, 60, 120, 30) with Ichimoku instead of the classic one but I find the original one much more reliable.Note
On the hourly chart(a) The Kumo (cloud) (hourly) is a support
(b) but the Tenkan sen (blue) and the Senkan Span B (red line of the cloud) should be a resistance
Note
the (b) on the left is (a) ;-)Note
Note
Will this sideway action end like the one we had end July?Note
I must admit the momentum is pretty bullish now.However volumes are not there to confirm that and there is a bearish divergence on the 4H timeframe.
Trade active
Shooting star + Bearish divergence.Let's go down now
Note
Now a bearish divergence on MACD (4h) on top of the one on the RSI (4h)Note
So sweet, BTC broke down just after reaching the .618 Fib. retracement.How long will the current support hold the fall of BTC?
Trade closed manually
I think we will have a correction after the huge drop we had. See my most recent posts to have the latest updates
Note
I closed my trade at least temporarily for the reasons mentioned on the graph belowDisclaimer
The information and publications are not meant to be, and do not constitute, financial, investment, trading, or other types of advice or recommendations supplied or endorsed by TradingView. Read more in the Terms of Use.
Disclaimer
The information and publications are not meant to be, and do not constitute, financial, investment, trading, or other types of advice or recommendations supplied or endorsed by TradingView. Read more in the Terms of Use.