this would be a little long idea, I'm sincerely asking you to read until the end with all the comments to understand my idea completely.
I'm gonna analyze the bitcoin chart from weekly to hourly time frame and using some kind of different indicators to see as much reaction and knots as we can to find the proper behavior of price since the last dump.
generally, I have 2 kinds of view for this idea: 1- bullish and. 2- correctional. I believe there is no falling or another dumping view for this chart anymore ( at least until there is no global financial crisis ).
we start from weekly :
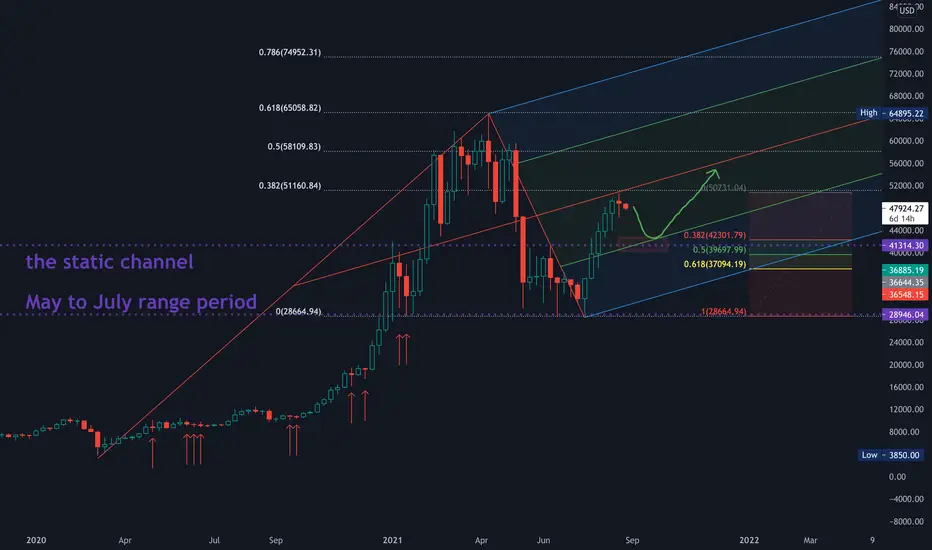
as I see from the start of the bullish movement in march 2020 we reach the ATH of almost $65k which was the 0.68 point of FIBO extension, then we had a retrace to 0 points of it.
As can be seen from the past chart. The price will not grow evenly, so we need retracements along the way.
And given the location and collisions of the candlesticks with the specified levels, the price may be currently in a place that needs a retracement.
From the beginning of the last uptrend on July 19, 2021, until now, we have started a perfect bullish movement, and now it is possible to retrace it by reaching the first target, which is the range of 0.38 Fibo and median fork.
considered the target :
Given that the static channel front range (indicate in purple) with a green line ( representing the 50% range of the fork) can indicate a good level for the target of the corrective movement.
I'm gonna analyze the bitcoin chart from weekly to hourly time frame and using some kind of different indicators to see as much reaction and knots as we can to find the proper behavior of price since the last dump.
generally, I have 2 kinds of view for this idea: 1- bullish and. 2- correctional. I believe there is no falling or another dumping view for this chart anymore ( at least until there is no global financial crisis ).
we start from weekly :
as I see from the start of the bullish movement in march 2020 we reach the ATH of almost $65k which was the 0.68 point of FIBO extension, then we had a retrace to 0 points of it.
As can be seen from the past chart. The price will not grow evenly, so we need retracements along the way.
And given the location and collisions of the candlesticks with the specified levels, the price may be currently in a place that needs a retracement.
From the beginning of the last uptrend on July 19, 2021, until now, we have started a perfect bullish movement, and now it is possible to retrace it by reaching the first target, which is the range of 0.38 Fibo and median fork.
considered the target :
Given that the static channel front range (indicate in purple) with a green line ( representing the 50% range of the fork) can indicate a good level for the target of the corrective movement.
Note
when we check the RSI in the WEEKLY rime frame we can also see that there is a resistance which price reacted to it and heading to the 50 % line.due to the behavior of the past, rsi MAY break 50% line and reach the support line beneath.
Note
DOMINANCE also is ranging in a static channel which we can imply that as long as dominance does not break the channel we could not expect a sharp and powerful movement behavior for the price.Note
in the daily time frame we can see how perfect price reaches its targets from 0 to 1 point of Fibo extension.
and also the loss of momentum is so obvious.
Note
in the daily time frame, RSI is also in a downtrend and it will be until It can break the bearish trend line, but we should consider that 50% level of RSI in daily time frame was respectful always so there is a possible reaction to that level.MACD is also in the bearish phase we had the cross already and the histogram growing under the zero line which indicates the sellers are getting more power.
however it could react to the yellow trend line .
Note
in daily time frame is struggling with the midline of the static channel.we can see from the past there was a pump after any range so it could be the same scenario here which may cause the price to retrace.
and the midline was a respectful level always.
Note
in 4-hour time frame, we have lots of information first, check how perfectly the candles react to the different levels of the FIBO. so as I mentioned before after reaching the target of 1 we could have a correction wave in which any of the fibo levels could be a knot for price and a potential reversal level.
there is a breakout and a perfect pull back from the bottom of the bullish channel which indicates momentum loss and reversal movement possibility.
Note
incase of reversal and correctional scenario we can indicate some levels for the target.
the low pivots and 3 important levels of Fibo retracement.
On the way down our targets have a different value for me to consider them as the price holder or reversal points.
for example, the purple dotted line which is the upper band of the range area ( static channel from May to July )
I believe is important but as we see it has not enough value to hold the price, so in case of reaching there is a possible and probable breakout and reaching to 50 % of Fibo , and the most powerful level is the 68% level of fibo .
On the other hand, I believe there could be also a range area here which I indicate with green box .
Note
4H RSI and MACD is also bearish supports and resistance levels are shown every thing
Note
Note
there are more bearish signs than bullishfor me :
bitcoin in the long term is powerfully bullish so if you want to invest in these temporary corrections shouldn't mind you.
if you are a trader you could find good points for opening short positions I believe.
and at the end, I'm not a financial adviser and I just try to explain what I see in the chart and analyze the behavior of the movement and the price.
be happy and DYOR
Note
watch this level carefully its importantNote
the second scenario ( orange ) happened I have some thought that may we have a couple of days or weeks range in the blue area even it could extend to the lower area, but the range is probable, until macD or RSI show us some sign of break out from range area.
its just an idea and could be false or fail so DYOR
Note
damn this analysis was totally correct , :)Order cancelled
DONEDisclaimer
The information and publications are not meant to be, and do not constitute, financial, investment, trading, or other types of advice or recommendations supplied or endorsed by TradingView. Read more in the Terms of Use.
Disclaimer
The information and publications are not meant to be, and do not constitute, financial, investment, trading, or other types of advice or recommendations supplied or endorsed by TradingView. Read more in the Terms of Use.