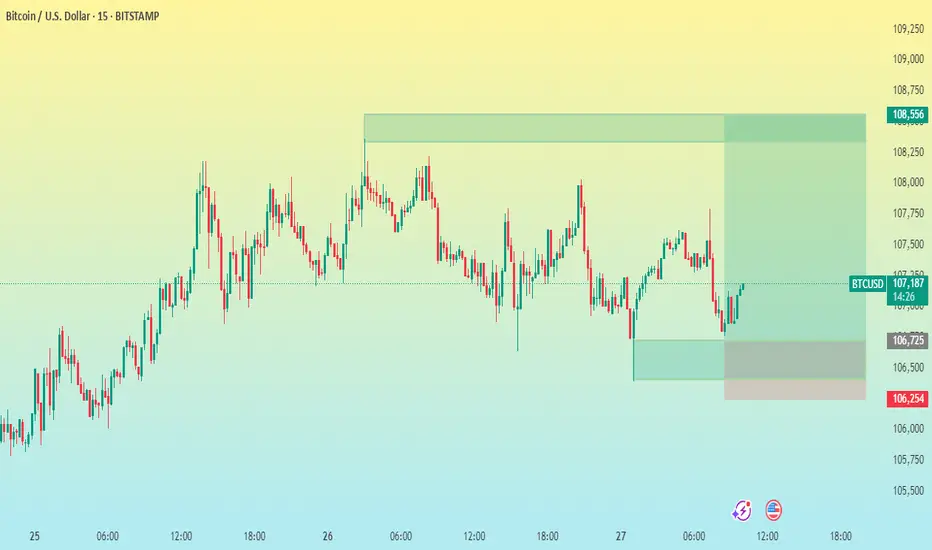
🕵♂ Chart Context
Asset: Bitcoin (BTC) vs. USD
Exchange: Bitstamp
Timeframe: 15-minute
Date Range: June 25–27, 2025
Chart Type: Candlestick
---
📊 Technical Analysis
1. Trend
Short-term trend: Sideways to slightly bullish.
Market saw an earlier uptrend, then consolidation with lower highs and higher lows (forming a range).
Price is currently rebounding from the lower part of the range.
2. Key Levels
Entry Level: ~107,123 – likely where a long trade was entered.
Support Zone:
Minor: 106,725
Strong: 106,254 (stop-loss level, clear structure support)
Resistance Zone / Target: 108,556 – a prior high and possible supply zone.
3. Risk-Reward Ratio
Entry: 107,123
SL: 106,254 (−869 points)
TP: 108,556 (+1,433 points)
RR Ratio: ≈ 1.65:1 – acceptable for intraday trading.
t.me/+vT7LZx7w13BlNjI0
✅ XAUUSD SIGNALS
💯JOIN FREE TELEGRAM CHANNEL
t.me/+vT7LZx7w13BlNjI0
✔REGISTERED broker
partners.vantagemarkets.com/ib-cpa-register/?url=ib&affid=7264705
✔Referral code 72647
✅ XAUUSD SIGNALS
💯JOIN FREE TELEGRAM CHANNEL
t.me/+vT7LZx7w13BlNjI0
✔REGISTERED broker
partners.vantagemarkets.com/ib-cpa-register/?url=ib&affid=7264705
✔Referral code 72647
Disclaimer
The information and publications are not meant to be, and do not constitute, financial, investment, trading, or other types of advice or recommendations supplied or endorsed by TradingView. Read more in the Terms of Use.
t.me/+vT7LZx7w13BlNjI0
✅ XAUUSD SIGNALS
💯JOIN FREE TELEGRAM CHANNEL
t.me/+vT7LZx7w13BlNjI0
✔REGISTERED broker
partners.vantagemarkets.com/ib-cpa-register/?url=ib&affid=7264705
✔Referral code 72647
✅ XAUUSD SIGNALS
💯JOIN FREE TELEGRAM CHANNEL
t.me/+vT7LZx7w13BlNjI0
✔REGISTERED broker
partners.vantagemarkets.com/ib-cpa-register/?url=ib&affid=7264705
✔Referral code 72647
Disclaimer
The information and publications are not meant to be, and do not constitute, financial, investment, trading, or other types of advice or recommendations supplied or endorsed by TradingView. Read more in the Terms of Use.