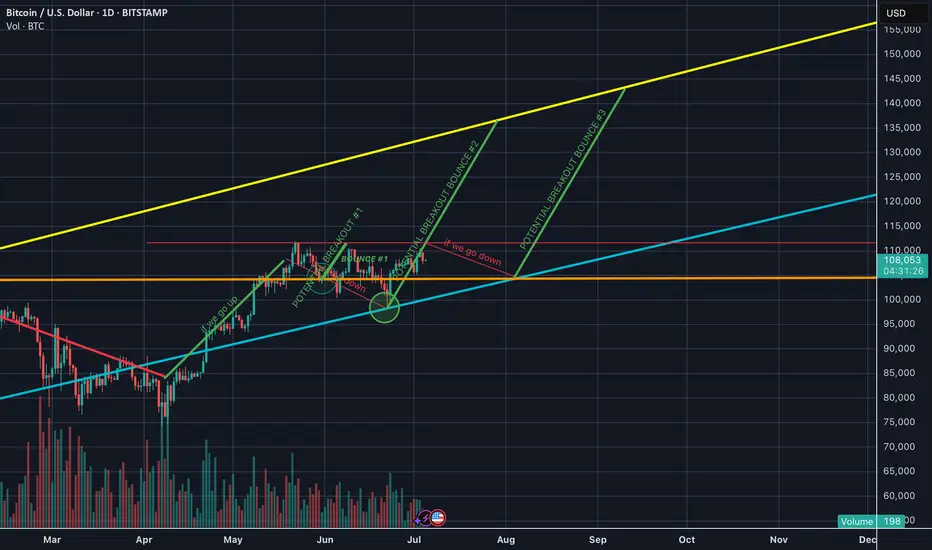
BTC is currently trading around $108,000, sitting at a key trendline support zone. The market is at a critical decision point, with two main scenarios: a bullish breakout or a rejection and move lower.
🔍 Technical Structure Overview
Chart timeframe: 1D (Daily)
Major support: $104,000 (horizontal) & ascending trendline (cyan)
Major resistance: $110,000–$112,000 zone
Long-term resistance channel: Yellow trendline capping BTC near $140,000
Volume: Currently low — needs a spike to confirm any breakout
🟢 Bullish Scenario
BTC bounces off the ascending trendline (current zone)
A strong breakout above $112,000 with volume would confirm a Potential Breakout Bounce #2
Targets:
$120,000 (short-term)
$130,000–$140,000 (upper yellow trendline in long-term channel)
✅ Confirmation needed:
Daily candle close above $112K with high volume
RSI rising above 50, MACD bullish crossover would help confirm move
🔴 Bearish Scenario
BTC fails to hold the trendline and breaks below $104,000
This confirms a rejection and a likely move toward $96,000
If momentum weakens, this could turn into a deeper correction or sideways consolidation
BTC is in a tight consolidation range, nearing a major decision point. A breakout above resistance could send prices to new local highs, while failure to hold trendline support will likely trigger a correction. Watch key levels carefully and let volume + momentum indicators confirm your trade.
Disclaimer
The information and publications are not meant to be, and do not constitute, financial, investment, trading, or other types of advice or recommendations supplied or endorsed by TradingView. Read more in the Terms of Use.
Disclaimer
The information and publications are not meant to be, and do not constitute, financial, investment, trading, or other types of advice or recommendations supplied or endorsed by TradingView. Read more in the Terms of Use.