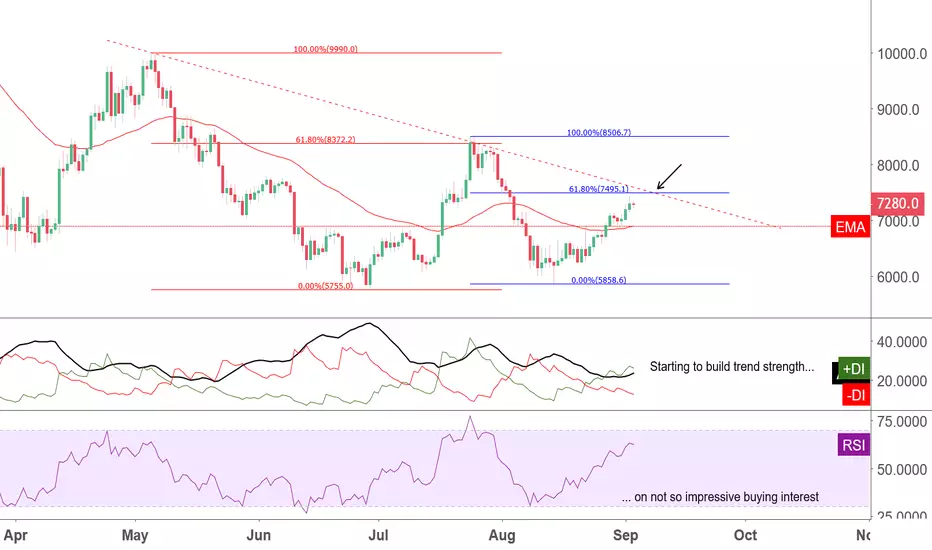
$7,495.10 is the golden ratio line to watch this week as key resistance.
The black arrow marks an intersection of the bearish dotted trend line and the blue 61.8% Fibonacci level. This intersection is the spot where resistance is likely to be tested, but can price break to the upside this week?
The last time a key 61.8% Fibonacci level was tested the market held as a ceiling. The red 61.8% level shows where the rally stalled and dropped back. The Average Directional Index (ADX) at the time the red 61.8% line was being examined, price was looking to stall and indicators were gearing up for the bull trend momentum to dry up.
As price approaches the blue 61.8% level this time the ADX is making a small turn to the upside, and staying inside the 20-30 trend strength building zone. This indicates a small amount of buying interest is building and trying, but is likely not enough to push through this intersection of resistance. (There is a bearish divergence going on inside tighter time frame charts)
A break of the blue 61.8% Fibonacci level to the upside would set up a full retracement to the blue 100% level, which would put us right back to the test of the red 61.8% Fibonacci level. The red 61.8% level is the ceiling level price needs to break to get this market back in the bull camp longer-term.
For now a break to the upside is slim at the moment. If the blue 61.8% Fibonacci level is not breached this week, back to previous lows we go.
Critical Resistance: $8,372.20
Key Resistance: $7,495.10
Key Support: $6,872.00
Critical Support: $5,858.60
Disclaimer
The information and publications are not meant to be, and do not constitute, financial, investment, trading, or other types of advice or recommendations supplied or endorsed by TradingView. Read more in the Terms of Use.
Disclaimer
The information and publications are not meant to be, and do not constitute, financial, investment, trading, or other types of advice or recommendations supplied or endorsed by TradingView. Read more in the Terms of Use.