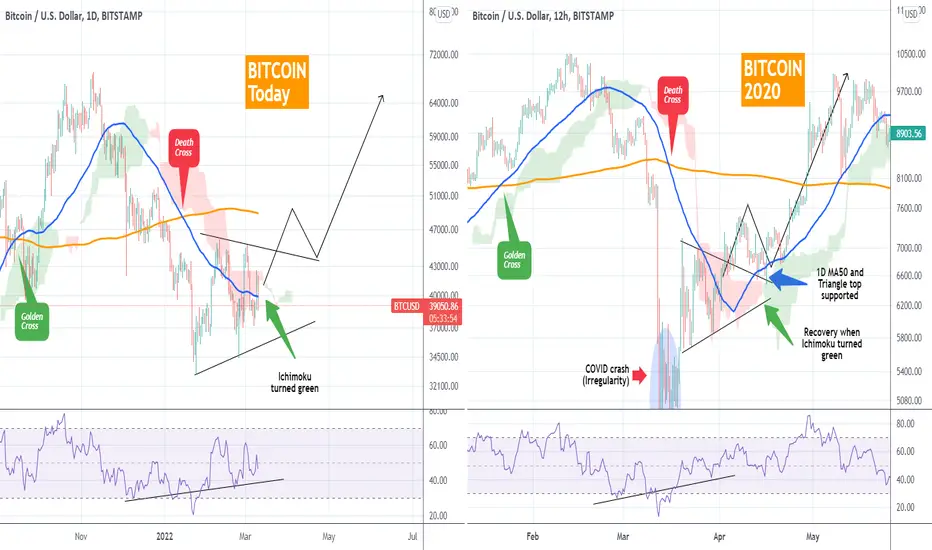
Another fractal analysis on Bitcoin. This time I compare today's price action on the 1D time-frame versus the February - April 2020 price action on the 12H time-frame. The reason for the difference between time-frames is the rate of variability. Due to the COVID flash crash of March 2020 and the equally fast and impressive recovery of the global markets due to the enormous money printing in the form of economic rescue packages, things evolved much faster in 2020.
As you see, both in RSI terms and other indicators (MA50, MA200, Golden and Death Crosses), the two fractals are very similar. If we ignore the irregularity of the 1 week meltdown in mid-March, the 2020 Triangle was a market bottom formation. The market accumulated after the economic reassurances by the Fed and U.S. government in the form of this Triangle and after a break above the MA50 (blue trend-line), BTC broke above the Lower Highs (top) of the pattern. After it re-tested the top and the MA50 as a Support and held, the Ichimoku Cloud turned green and then entered an aggressive multi-month parabolic rally, which never looked back.
Right now Bitcoin is still (accumulating?) within the Triangle, around the 1D MA50, but with the Ichimoku Cloud just turning green. Do you think this is a sign of bottoming? Will a break above the Triangle set in motion a rally similar to April-May 2020? Feel free to share your work and let me know in the comments section below!
--------------------------------------------------------------------------------------------------------
Please like, subscribe and share your ideas and charts with the community!
--------------------------------------------------------------------------------------------------------
👑Best Signals (Forex/Crypto+70% accuracy) & Account Management (+20% profit/month on 10k accounts)
💰Free Channel t.me/tradingshotglobal
🤵Contact info@tradingshot.com t.me/tradingshot
🔥New service: next X100 crypto GEMS!
💰Free Channel t.me/tradingshotglobal
🤵Contact info@tradingshot.com t.me/tradingshot
🔥New service: next X100 crypto GEMS!
Disclaimer
The information and publications are not meant to be, and do not constitute, financial, investment, trading, or other types of advice or recommendations supplied or endorsed by TradingView. Read more in the Terms of Use.