Bearish candlestick patterns are a cornerstone of technical analysis, relied upon by traders across financial markets to assess the likelihood of price reversals or continued downward trends. At their core, these patterns are visual representations of shifts in market sentiment, formed by the open, high, low, and close prices over one or several trading sessions. When recognized accurately and interpreted in context, bearish candlestick setups can alert market participants to the fading strength of buyers and the increasing presence of sellers, which often precedes downward price movements. Expanding on this, a comprehensive understanding of each pattern’s nuances, psychological underpinnings, and optimal trading applications can significantly enhance a trader’s analytical toolkit.
What will be discussed?
- What is a shooting star?
- What is a hanging man?
- What is a gravestone dojo?
- What is an evening star?
- What are the three black crows?
- How to trade the bearish candlestick patterns?
Shooting star
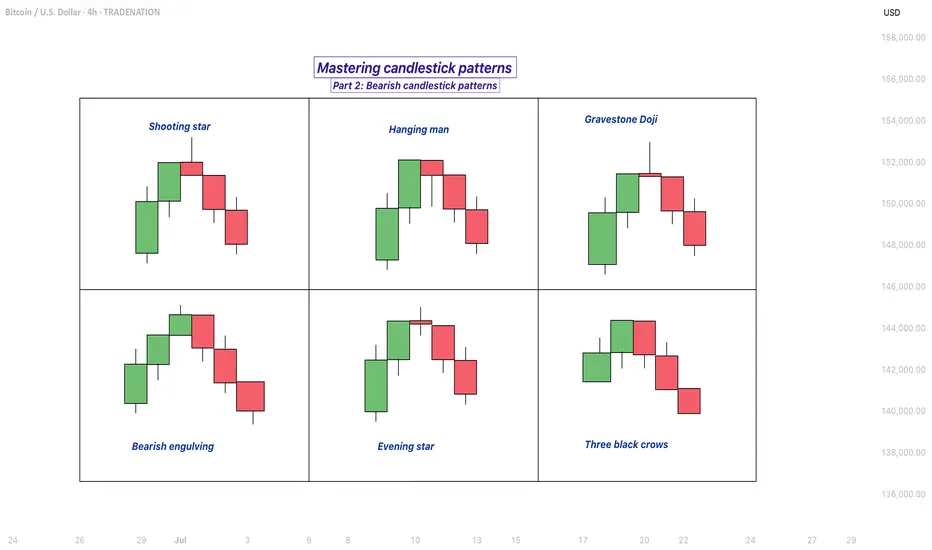
The shooting star pattern stands as a prominent candlestick configuration foreshadowing potential bearish reversals after an uptrend. This single-candle pattern is distinguished by a small real body situated near the lower end of the price range, a long upper shadow that is at least twice the length of the body, and little to no lower shadow. The psychological narrative implied by the shooting star is compelling: buyers initially control the session, pushing prices sharply higher, but by the close, sellers have overwhelmed this optimism, pulling the price back down to near or below the opening point. This abrupt shift in control suggests that the bullish momentum is waning, priming the market for a price correction or reversal.

Hanging man
The hanging man, while visually similar to the hammer pattern of bullish reversals, is distinctly bearish because of its position at the top of an established uptrend. This single-candle pattern features a small body at the upper part of the trading range and a markedly long lower shadow, again with minimal or absent upper shadow. During the session, substantial selling pressure drives prices down, accounting for the extended lower shadow, yet buyers temporarily regain some control, recovering much of the loss by the close. Despite this late-session recovery, the appearance of the hanging man warns traders that sellers are growing more aggressive – especially if the next candle confirms the weakness with a lower close.

Gravestone doji
A classic and somewhat ominous formation, the gravestone doji is a specialized form of doji candlestick that carries even greater weight when it appears after a rising market. Here, the open, close, and low are all clustered near the session’s low, forming a long upper shadow with no lower shadow. This structure vividly illustrates a dramatic shift in sentiment: buyers propel prices higher during the session, only to be met by intense selling which pushes prices back to the opening level by the close. This failed rally, marked by the upper wick, reflects the exhaustion of buying interest and the potential onset of bearish dominance.

Bearish engulfing
Turning to multi-candle setups, the bearish engulfing pattern is a powerful, two-bar reversal pattern. The initial candle is bullish and typically a continuation of the prevailing uptrend, but the second candle is bearish and must open above and close below the body of the first candle, “engulfing” it completely. The transition from a relatively small upward move to a much larger downward move highlights a rapid escalation in sell-side enthusiasm. Importantly, the larger the second candle and the greater the volume accompanying it, the more reliable the signal.

Evening star
The evening star expands the analysis further into a three-candlestick formation, representing a storyline of shifting market dynamics. The pattern commences with a long bullish candle, followed by an indecisive small candle (the star) that gaps above the previous close, and concludes with a large bearish candle that closes deep into the first candle’s body. The evening star is especially meaningful because it narrates a transition from bullish exhaustion to bearish control over three sessions, making it a robust signal of a pending trend reversal. The reliability of the evening star increases if the bearish candle is accompanied by high volume, confirming a surge in selling pressure.

Three black crows
Among the most striking bearish signals is the three black crows pattern. It comprises three consecutive large bearish candles, each opening within the body of the previous candle and closing successively lower. This pattern demonstrates relentless selling over several sessions, erasing prior gains and indicating that bearish sentiment is in full swing. Collectively, the three black crows can shift market psychology significantly when they appear after a lengthy uptrend, especially if accompanied by increased trading volume.

How to trade the bearish candlestick patterns?
Effectively using bearish candlestick patterns in a trading strategy requires more than mere recognition of shapes. The context in which these patterns emerge matters greatly; traders should analyze preceding price action, the scope of the trend, and any converging signals from other technical tools such as momentum oscillators or volume indicators. Confirmation is a best practice, waiting for a subsequent session that continues in the bearish direction can filter out false signals and decrease the chances of whipsaw trades.
In practice, traders may use these patterns to identify short-selling opportunities, define entry and exit points, or adjust stop-loss levels to protect profits as a trend appears to reverse. Risk management is crucial, as no pattern is infallible. Position sizing, stop-loss placement, and ongoing evaluation of the broader market environment all contribute to the prudent use of candlestick analysis. By integrating these patterns into a comprehensive market analysis framework, traders are better positioned to interpret crowd psychology, anticipate significant reversals, and navigate the complexities of price movement with a higher degree of confidence and skill.
-------------------------
Disclosure: I am part of Trade Nation's Influencer program and receive a monthly fee for using their TradingView charts in my analysis.
Thanks for your support. If you enjoyed this analysis, make sure to follow me so you don't miss the next one. And if you found it helpful, feel free to drop a like 👍 and leave a comment 💬, I’d love to hear your thoughts!
What will be discussed?
- What is a shooting star?
- What is a hanging man?
- What is a gravestone dojo?
- What is an evening star?
- What are the three black crows?
- How to trade the bearish candlestick patterns?
Shooting star
The shooting star pattern stands as a prominent candlestick configuration foreshadowing potential bearish reversals after an uptrend. This single-candle pattern is distinguished by a small real body situated near the lower end of the price range, a long upper shadow that is at least twice the length of the body, and little to no lower shadow. The psychological narrative implied by the shooting star is compelling: buyers initially control the session, pushing prices sharply higher, but by the close, sellers have overwhelmed this optimism, pulling the price back down to near or below the opening point. This abrupt shift in control suggests that the bullish momentum is waning, priming the market for a price correction or reversal.
Hanging man
The hanging man, while visually similar to the hammer pattern of bullish reversals, is distinctly bearish because of its position at the top of an established uptrend. This single-candle pattern features a small body at the upper part of the trading range and a markedly long lower shadow, again with minimal or absent upper shadow. During the session, substantial selling pressure drives prices down, accounting for the extended lower shadow, yet buyers temporarily regain some control, recovering much of the loss by the close. Despite this late-session recovery, the appearance of the hanging man warns traders that sellers are growing more aggressive – especially if the next candle confirms the weakness with a lower close.
Gravestone doji
A classic and somewhat ominous formation, the gravestone doji is a specialized form of doji candlestick that carries even greater weight when it appears after a rising market. Here, the open, close, and low are all clustered near the session’s low, forming a long upper shadow with no lower shadow. This structure vividly illustrates a dramatic shift in sentiment: buyers propel prices higher during the session, only to be met by intense selling which pushes prices back to the opening level by the close. This failed rally, marked by the upper wick, reflects the exhaustion of buying interest and the potential onset of bearish dominance.
Bearish engulfing
Turning to multi-candle setups, the bearish engulfing pattern is a powerful, two-bar reversal pattern. The initial candle is bullish and typically a continuation of the prevailing uptrend, but the second candle is bearish and must open above and close below the body of the first candle, “engulfing” it completely. The transition from a relatively small upward move to a much larger downward move highlights a rapid escalation in sell-side enthusiasm. Importantly, the larger the second candle and the greater the volume accompanying it, the more reliable the signal.
Evening star
The evening star expands the analysis further into a three-candlestick formation, representing a storyline of shifting market dynamics. The pattern commences with a long bullish candle, followed by an indecisive small candle (the star) that gaps above the previous close, and concludes with a large bearish candle that closes deep into the first candle’s body. The evening star is especially meaningful because it narrates a transition from bullish exhaustion to bearish control over three sessions, making it a robust signal of a pending trend reversal. The reliability of the evening star increases if the bearish candle is accompanied by high volume, confirming a surge in selling pressure.
Three black crows
Among the most striking bearish signals is the three black crows pattern. It comprises three consecutive large bearish candles, each opening within the body of the previous candle and closing successively lower. This pattern demonstrates relentless selling over several sessions, erasing prior gains and indicating that bearish sentiment is in full swing. Collectively, the three black crows can shift market psychology significantly when they appear after a lengthy uptrend, especially if accompanied by increased trading volume.
How to trade the bearish candlestick patterns?
Effectively using bearish candlestick patterns in a trading strategy requires more than mere recognition of shapes. The context in which these patterns emerge matters greatly; traders should analyze preceding price action, the scope of the trend, and any converging signals from other technical tools such as momentum oscillators or volume indicators. Confirmation is a best practice, waiting for a subsequent session that continues in the bearish direction can filter out false signals and decrease the chances of whipsaw trades.
In practice, traders may use these patterns to identify short-selling opportunities, define entry and exit points, or adjust stop-loss levels to protect profits as a trend appears to reverse. Risk management is crucial, as no pattern is infallible. Position sizing, stop-loss placement, and ongoing evaluation of the broader market environment all contribute to the prudent use of candlestick analysis. By integrating these patterns into a comprehensive market analysis framework, traders are better positioned to interpret crowd psychology, anticipate significant reversals, and navigate the complexities of price movement with a higher degree of confidence and skill.
-------------------------
Disclosure: I am part of Trade Nation's Influencer program and receive a monthly fee for using their TradingView charts in my analysis.
Thanks for your support. If you enjoyed this analysis, make sure to follow me so you don't miss the next one. And if you found it helpful, feel free to drop a like 👍 and leave a comment 💬, I’d love to hear your thoughts!
🔸 Free trading Discord
discord.gg/fVfJHHQSMG
🔹 Free trading signals
t.me/CandleCollective
discord.gg/fVfJHHQSMG
🔹 Free trading signals
t.me/CandleCollective
Related publications
Disclaimer
The information and publications are not meant to be, and do not constitute, financial, investment, trading, or other types of advice or recommendations supplied or endorsed by TradingView. Read more in the Terms of Use.