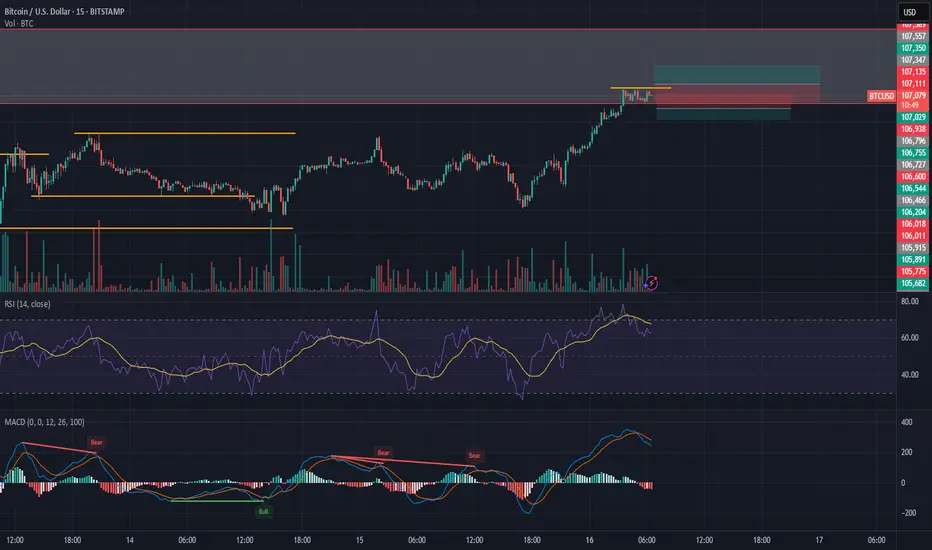
BTC/USD 15-Minute Chart Analysis – June 16, 2025 – 06:25 UTC-4
Exchange: Bitstamp | Current Price: $107,149
Trend: Short-term recovery from previous dump; nearing local resistance zone
Market Context: Rebound after consolidation below $106K; price testing $107.3K ceiling
📈 Technical Indicator Summary
1. RSI (14)
RSI: 67.40, close to overbought zone
Signal line: 69.48
➡️ Strong bullish momentum, but approaching exhaustion; potential pullback or consolidation soon
2. MACD (12,26,9)
MACD line > Signal line — bullish crossover confirmed
Histogram green and above 0, but flattening
➡️ Positive momentum remains, but bullish strength is fading
3. Volume
Volume increasing during upswings, declining during sideways phases
➡️ Accumulation confirmed; buyers were stepping in under $106K
4. Structure / Key Levels
🔻 Support Zones:
$106,600: Minor local support
$105,775 – $105,341: Consolidation demand zone
$105,000: Psychological & historical support
🔺 Resistance Zones:
$107,149: Current price, testing key resistance
$107,350 – $107,589: Major overhead barrier
Breakout could target: $108,000+
🎯 Trade Scenarios (Next 24 Hours)
✅ Scenario 1: Bullish Breakout Above $107,350
Conditions:
RSI stays above 60
MACD remains bullish
Price closes above $107,350 with volume spike
Entry:
📈 Buy breakout above $107,350
🎯 TP1: $107,750
🎯 TP2: $108,400
🛑 SL: $106,750 (below most recent higher low)
❌ Scenario 2: Rejection and Pullback from Resistance
Conditions:
RSI breaks below 60
MACD begins to turn down (bearish crossover)
Price fails to hold $107,149 and closes below $106,600
Entry:
📉 Sell on rejection from $107,350 + bearish divergence
🎯 TP1: $106,200
🎯 TP2: $105,800
🛑 SL: $107,550
📊 Probability Forecast (Next 24 Hours)
Scenario Probability Rationale
✅ Bullish Breakout 70% - Clean higher low structure
MACD + RSI strong
Testing resistance repeatedly = buildup for breakout |
| ❌ Pullback / Rejection | 30% | - RSI nearing overbought
Resistance near $107.6–107.8K is heavy
Possible fakeout if no volume follows |
🧠 Strategic Insight:
Momentum favors bulls, but resistance is thick between $107.3K and $107.6K.
Favor breakout entries on confirmation — not pre-break bets.
Watch RSI/MACD divergences closely.
Disclaimer
The information and publications are not meant to be, and do not constitute, financial, investment, trading, or other types of advice or recommendations supplied or endorsed by TradingView. Read more in the Terms of Use.
Disclaimer
The information and publications are not meant to be, and do not constitute, financial, investment, trading, or other types of advice or recommendations supplied or endorsed by TradingView. Read more in the Terms of Use.