📉 Technical Structure
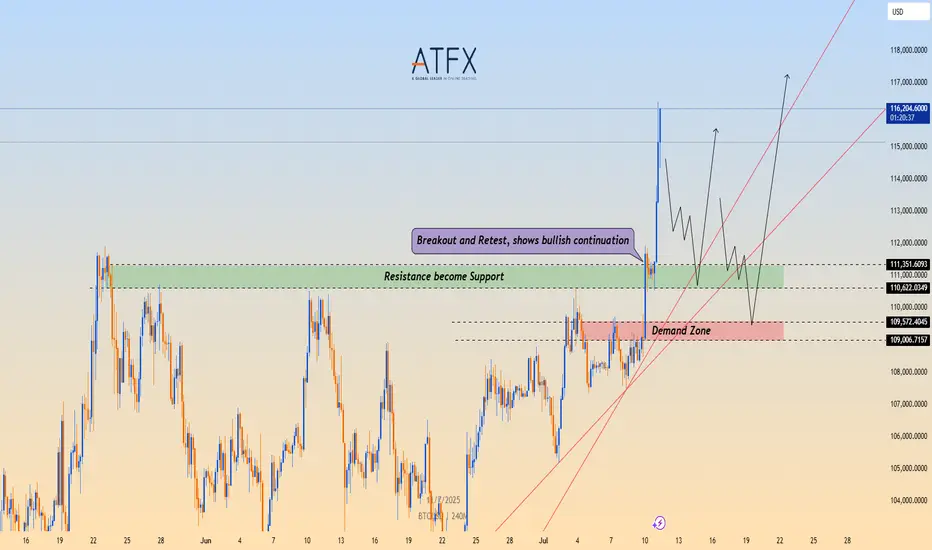
 BTCUSD BTC/USD confirmed a bullish breakout above the $111,000–$111,350 resistance zone, which has now flipped into support. Price action shows a clean retest and bounce from this level, indicating a bullish continuation. Key support lies at the $110,600–$109,000 demand zone. If the price clears $116,800, bulls may target $118,000–$120,000 next.
📈 Long Trade Setup
Entry: $111,350
Stop Loss: $109,000
Take Profit 1: $116,800
Take Profit 2: $118,000
Invalidation: Break below $109,000 and trendline
🌐 Macro Background
BTCUSD Bitcoin rallied above $116,000 to a new all-time high after clearing the $111,000 resistance. The breakout was supported by strong momentum and optimism following a technical trendline breach. Despite some selling pressure and rising funding rates, the broader trend remains bullish. A sustained move above $116,800 could open the door toward $120,000.
📌 Key Technical Zones
Resistance: $116,800 / $118,000
Support: $110,622–$111,350, $109,006–$109,572
📘 Trade Summary
As long as BTC/USD remains above $111,350, the bullish structure is valid. Short-term pullbacks into the $109,006–$109,572 zone may offer buying opportunities.
⚠️ Disclaimer
This analysis is for informational purposes only and does not constitute investment advice.
📈 Long Trade Setup
Entry: $111,350
Stop Loss: $109,000
Take Profit 1: $116,800
Take Profit 2: $118,000
Invalidation: Break below $109,000 and trendline
🌐 Macro Background
📌 Key Technical Zones
Resistance: $116,800 / $118,000
Support: $110,622–$111,350, $109,006–$109,572
📘 Trade Summary
As long as BTC/USD remains above $111,350, the bullish structure is valid. Short-term pullbacks into the $109,006–$109,572 zone may offer buying opportunities.
⚠️ Disclaimer
This analysis is for informational purposes only and does not constitute investment advice.
ATFX is a globally regulated, award-winning fintech broker offering customer support in 20 languages.
👉🏼Start your trading journey with ATFX: bit.ly/3mLMPHz
👉🏼Start your trading journey with ATFX: bit.ly/3mLMPHz
Disclaimer
The information and publications are not meant to be, and do not constitute, financial, investment, trading, or other types of advice or recommendations supplied or endorsed by TradingView. Read more in the Terms of Use.