Hello!
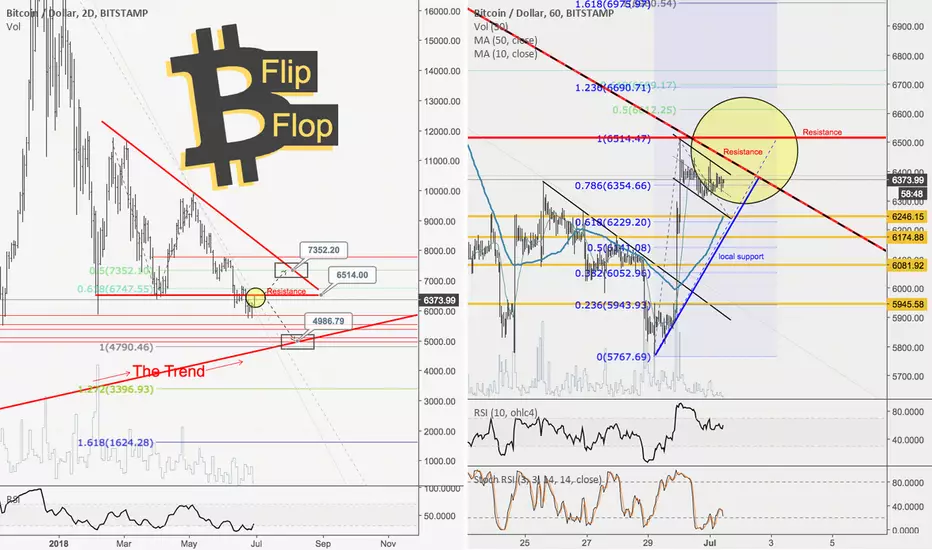
Multi timeframe analysis is there.
Recently we meet Local resistance at $6514 (red horizontal line) Which is bottom of Descending Triangle (Red on 2D chart at left).
Now it need to break $6514, to move on higher resistance $7352, which will be hard for bulls IMO.
If bulls will fail breaking this resistance, we will probably see reloaded bears for final rush to The Trend and Global Support, where the huge demand is located:
Global Support $4790-5000
Watch price movement on 1h chart and wait for price action in Yellow Circle, as here we've got 2 resistances.
Good luck!
Learn more from previous ideas:
June 13, Wyckoff Accumulation Process for BTC: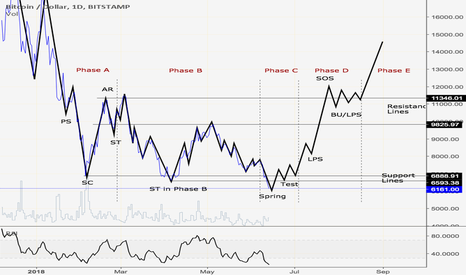
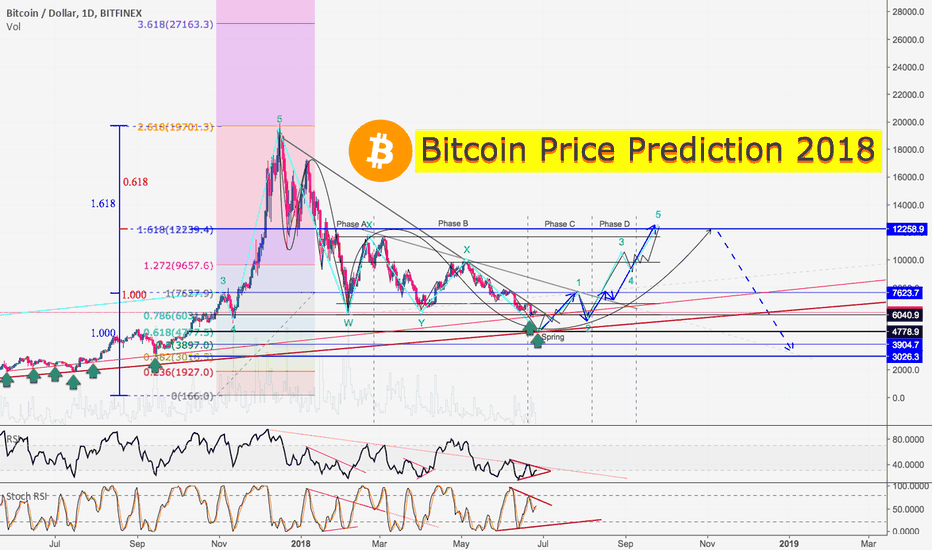
June 26, Bitcoin Price Prediction for 2018:
Multi timeframe analysis is there.
Recently we meet Local resistance at $6514 (red horizontal line) Which is bottom of Descending Triangle (Red on 2D chart at left).
Now it need to break $6514, to move on higher resistance $7352, which will be hard for bulls IMO.
If bulls will fail breaking this resistance, we will probably see reloaded bears for final rush to The Trend and Global Support, where the huge demand is located:
Global Support $4790-5000
Watch price movement on 1h chart and wait for price action in Yellow Circle, as here we've got 2 resistances.
Good luck!
Learn more from previous ideas:
June 13, Wyckoff Accumulation Process for BTC:
June 26, Bitcoin Price Prediction for 2018:
Note
Price near Flag supportNote
Possible Movement, same fractals:Note
Trading is chock full of paradoxes and contradictions in thinking that make it extremely difficult to learn how to be successful. In fact, if I had to choose one word that encapsulates the nature of trading, it would be "paradox."
(According to the dictionary, a paradox is something that seems to have contradictory qualities or that is contrary to common belief or what generally makes sense to people.)
Financial and emotional disaster are common among traders because many of the perspectives, attitudes, and principles that would otherwise make perfect sense and work quite well in our daily lives
have the opposite effect in the trading environment. They just don't work.
Note
pumpTrade active
Broken resistance, active 7200 target📲 Join Telegram Trading Community: t.me/+5hlxWmhHaKplN2Rk
🎙️ 𝘾𝙊𝙈𝙄𝙉𝙂 𝙎𝙊𝙊𝙉 Daily Live Streams on 🔴 𝗬𝗼𝘂𝗧𝘂𝗯𝗲
🔍 linktr.ee/artemcrypto ✅
🎙️ 𝘾𝙊𝙈𝙄𝙉𝙂 𝙎𝙊𝙊𝙉 Daily Live Streams on 🔴 𝗬𝗼𝘂𝗧𝘂𝗯𝗲
🔍 linktr.ee/artemcrypto ✅
Related publications
Disclaimer
The information and publications are not meant to be, and do not constitute, financial, investment, trading, or other types of advice or recommendations supplied or endorsed by TradingView. Read more in the Terms of Use.
📲 Join Telegram Trading Community: t.me/+5hlxWmhHaKplN2Rk
🎙️ 𝘾𝙊𝙈𝙄𝙉𝙂 𝙎𝙊𝙊𝙉 Daily Live Streams on 🔴 𝗬𝗼𝘂𝗧𝘂𝗯𝗲
🔍 linktr.ee/artemcrypto ✅
🎙️ 𝘾𝙊𝙈𝙄𝙉𝙂 𝙎𝙊𝙊𝙉 Daily Live Streams on 🔴 𝗬𝗼𝘂𝗧𝘂𝗯𝗲
🔍 linktr.ee/artemcrypto ✅
Related publications
Disclaimer
The information and publications are not meant to be, and do not constitute, financial, investment, trading, or other types of advice or recommendations supplied or endorsed by TradingView. Read more in the Terms of Use.