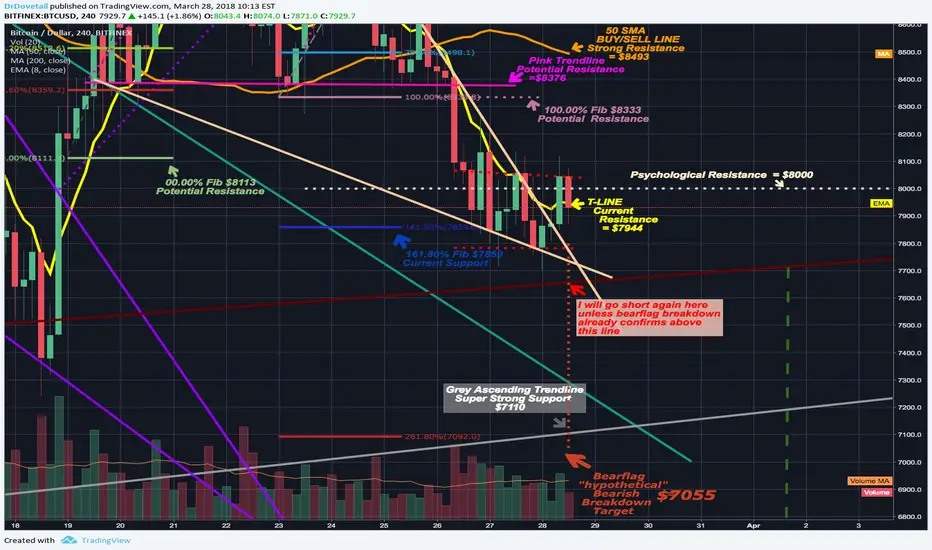
My last idea about the descending wedge and the bearflag we are currently in I realized I didn't update my current support/resistance zones and their numbers so I decided to make another idea reflecting the most updated support and resistance line information. current Resistance is the tline and just above that the top dotted red trendline of the bearflag, current support is the blue fib retracement line and below that the bottom dotted red trendline of the ebar flag and also both tan trendlines of the descending triangle could offer support. We are now 13 candles deep into this bear flag this is a long one but usually we see a breakout of a flag around the 6th candle so I expect a breakout sometime soon within the next 2 4 hour candles.....I'm greatly hoping for a break upward but both upward or downward are very much plausible which is why for now I remain neutral.
Disclaimer
The information and publications are not meant to be, and do not constitute, financial, investment, trading, or other types of advice or recommendations supplied or endorsed by TradingView. Read more in the Terms of Use.
Disclaimer
The information and publications are not meant to be, and do not constitute, financial, investment, trading, or other types of advice or recommendations supplied or endorsed by TradingView. Read more in the Terms of Use.