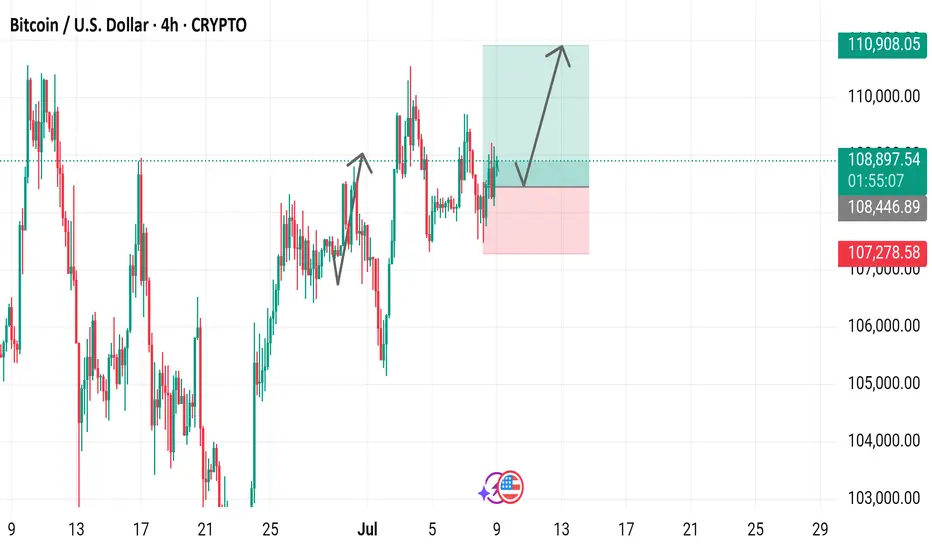
4-hour candlestick chart displays the price movement of Bitcoin (BTC) against the U.S. Dollar (USD) from late June to early July 2025. The current price is $108,895.04, with a 24-hour change of +$619.70 (+0.57%). Key levels include a support zone around $107,278.58 and a resistance near $110,908.05. The chart highlights recent price action, including a potential upward trend indicated by a green shaded area, with buy and sell signals marked at $108,895.04.
Trade closed: target reached
Perfect target achieved Daily XAU/USD FREE setups | Let's grow together!
| XAU/USD Trader | Telegram: https://t.me/Aleegoldsignals
| XAU/USD Trader | Telegram: https://t.me/Aleegoldsignals
Disclaimer
The information and publications are not meant to be, and do not constitute, financial, investment, trading, or other types of advice or recommendations supplied or endorsed by TradingView. Read more in the Terms of Use.
Daily XAU/USD FREE setups | Let's grow together!
| XAU/USD Trader | Telegram: https://t.me/Aleegoldsignals
| XAU/USD Trader | Telegram: https://t.me/Aleegoldsignals
Disclaimer
The information and publications are not meant to be, and do not constitute, financial, investment, trading, or other types of advice or recommendations supplied or endorsed by TradingView. Read more in the Terms of Use.