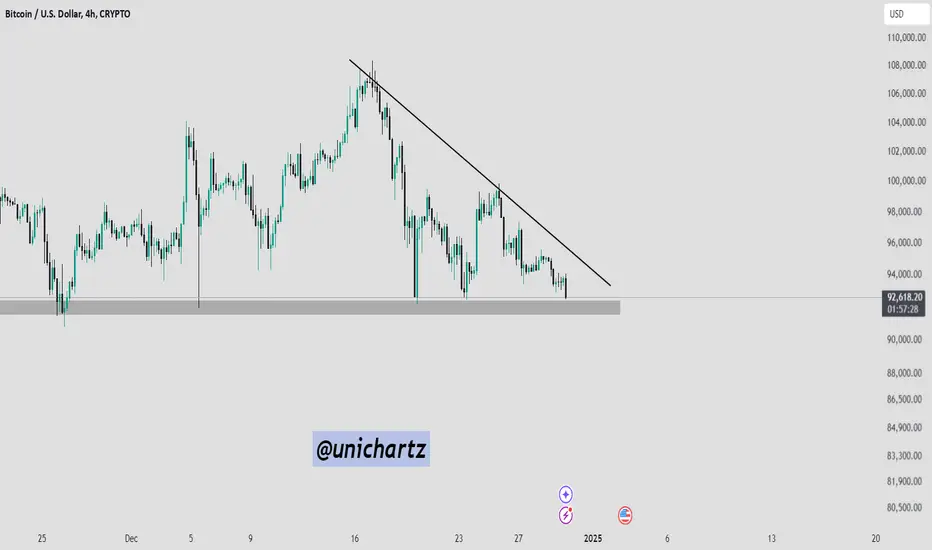
The BTC/USD 4-hour chart highlights a key support zone at $91,600–$92,200, acting as a strong barrier against further downside. The price is consolidating near this level, with a descending trendline adding bearish pressure.
A bounce from this support could retest the trendline around $94,000–$95,000, while a break below $91,600 may trigger a decline toward $86,000 or lower. Traders should watch for confirmation of a bounce or breakdown.
A bounce from this support could retest the trendline around $94,000–$95,000, while a break below $91,600 may trigger a decline toward $86,000 or lower. Traders should watch for confirmation of a bounce or breakdown.
Disclaimer
The information and publications are not meant to be, and do not constitute, financial, investment, trading, or other types of advice or recommendations supplied or endorsed by TradingView. Read more in the Terms of Use.
Disclaimer
The information and publications are not meant to be, and do not constitute, financial, investment, trading, or other types of advice or recommendations supplied or endorsed by TradingView. Read more in the Terms of Use.
