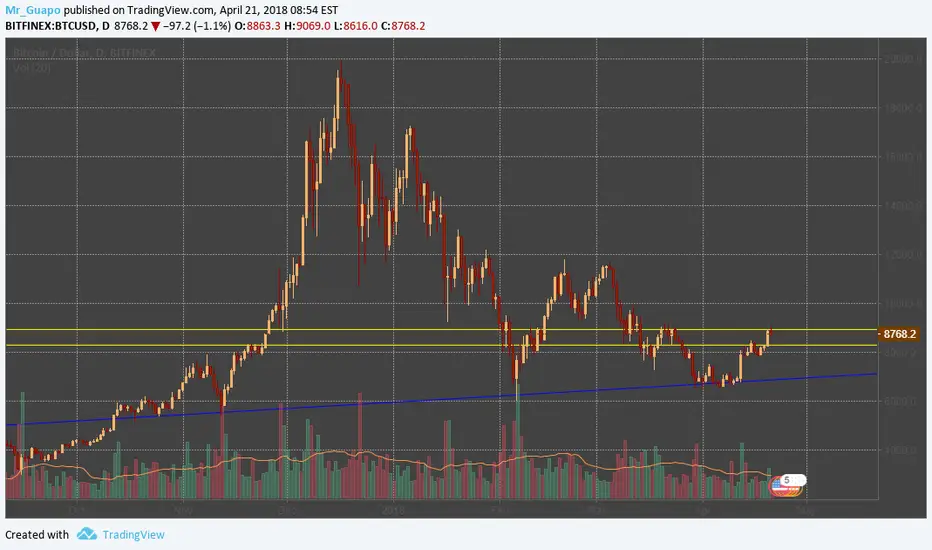
Will fluctuate between the two yellow lines and eventually break up or down, if it passes the 10000$ region then we will have a bull run. If it breaks down, hopefully will find support on the blue line.
Disclaimer
The information and publications are not meant to be, and do not constitute, financial, investment, trading, or other types of advice or recommendations supplied or endorsed by TradingView. Read more in the Terms of Use.
Disclaimer
The information and publications are not meant to be, and do not constitute, financial, investment, trading, or other types of advice or recommendations supplied or endorsed by TradingView. Read more in the Terms of Use.