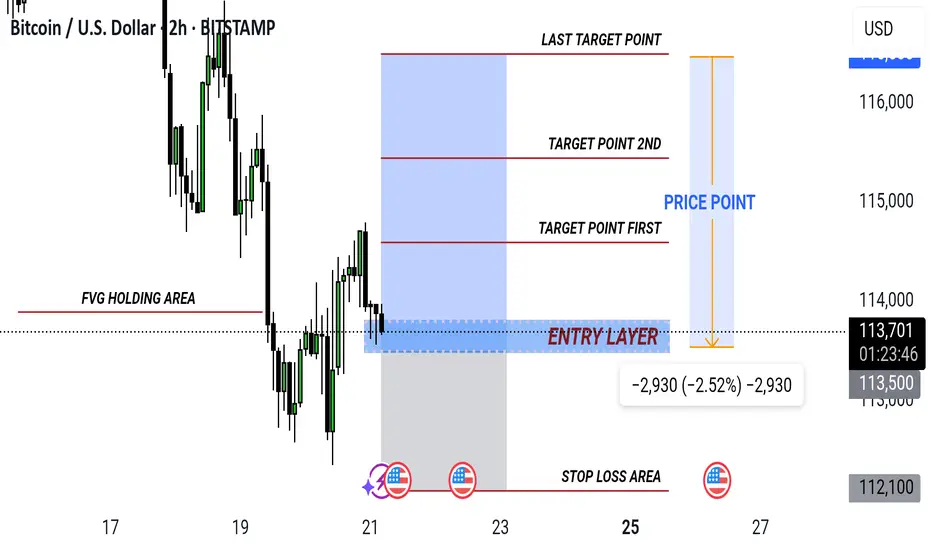
This is a Bitcoin (BTC/USD) trading chart on the 2-hour timeframe (2h) from TradingView (BITSTAMP exchange). The chart is structured as a trading setup plan with defined entry, target, and stop loss zones. Let me break it down step by step:
🔹 Key Levels & Zones
Entry Layer (Blue Zone)
Around 113,500 – 113,800 USD.
This is the suggested buy entry area.
Price is currently hovering in this region (113,793 USD).
Target Points (Profit-taking levels)
Target Point First → Around 114,500 USD.
Target Point 2nd → Around 115,500 USD.
Last Target Point → Around 116,000 USD.
Stop Loss Area (Gray Zone Below):
Marked at 112,100 USD.
If BTC falls here, the trade setup becomes invalid.
JOIN OUR TELEGRAM SIGNAL ROOM 👇
t.me/qaziforexmaster1
t.me/qaziforexmaster1
Disclaimer
The information and publications are not meant to be, and do not constitute, financial, investment, trading, or other types of advice or recommendations supplied or endorsed by TradingView. Read more in the Terms of Use.