BTC/USD Bearish Outlook Analysis 📉🧠
📊 Technical Overview:
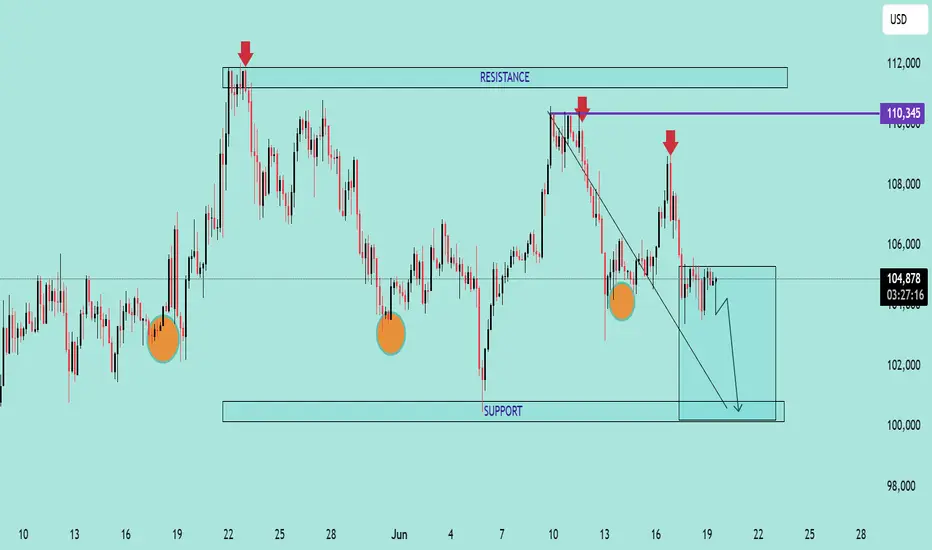
The BTC/USD chart is showing signs of a bearish structure formation, suggesting increased downside momentum in the short term.
🔻 Resistance Zone:
Clear resistance is identified near $110,345, marked by multiple price rejections (🔴 red arrows).
Price failed to break above this zone several times, indicating strong selling pressure.
🔸 Support Zone:
Strong support lies near the $100,000 psychological level.
Price has respected this zone multiple times (🟠 orange circles), indicating buyer interest.
📉 Current Price Action:
A descending trendline breakout attempt failed and price is now consolidating just below $105,000.
Price is forming a bearish flag/consolidation structure after recent rejection.
A breakdown from the current box range is likely to push BTC toward the support zone at $100,000.
📉 Bearish Scenario:
If BTC breaks below $104,000, expect continuation towards $100,000.
A daily candle close below support could signal further downside.
📈 Invalidation:
Bullish invalidation occurs if BTC reclaims and closes above $108,000, with volume, retesting resistance at $110,345.
🧭 Summary:
BTC/USD is exhibiting a lower highs structure within a descending channel. Unless it breaks above the resistance zone, the bias remains bearish with a high probability of retesting support.
📊 Technical Overview:
The BTC/USD chart is showing signs of a bearish structure formation, suggesting increased downside momentum in the short term.
🔻 Resistance Zone:
Clear resistance is identified near $110,345, marked by multiple price rejections (🔴 red arrows).
Price failed to break above this zone several times, indicating strong selling pressure.
🔸 Support Zone:
Strong support lies near the $100,000 psychological level.
Price has respected this zone multiple times (🟠 orange circles), indicating buyer interest.
📉 Current Price Action:
A descending trendline breakout attempt failed and price is now consolidating just below $105,000.
Price is forming a bearish flag/consolidation structure after recent rejection.
A breakdown from the current box range is likely to push BTC toward the support zone at $100,000.
📉 Bearish Scenario:
If BTC breaks below $104,000, expect continuation towards $100,000.
A daily candle close below support could signal further downside.
📈 Invalidation:
Bullish invalidation occurs if BTC reclaims and closes above $108,000, with volume, retesting resistance at $110,345.
🧭 Summary:
BTC/USD is exhibiting a lower highs structure within a descending channel. Unless it breaks above the resistance zone, the bias remains bearish with a high probability of retesting support.
JOIN MY TELEGRAM CHANNEL
t.me/StellarMarketAnalysis
JOIN MY RECOMMENTED BROKER REFFREL LINK
⤵️one.exnesstrack.net/a/uvd1etcgg1
PARTNER CODE⤵️
uvd1etcgg1
t.me/StellarMarketAnalysis
JOIN MY RECOMMENTED BROKER REFFREL LINK
⤵️one.exnesstrack.net/a/uvd1etcgg1
PARTNER CODE⤵️
uvd1etcgg1
Disclaimer
The information and publications are not meant to be, and do not constitute, financial, investment, trading, or other types of advice or recommendations supplied or endorsed by TradingView. Read more in the Terms of Use.