Quick post to map nearby zones of interest.
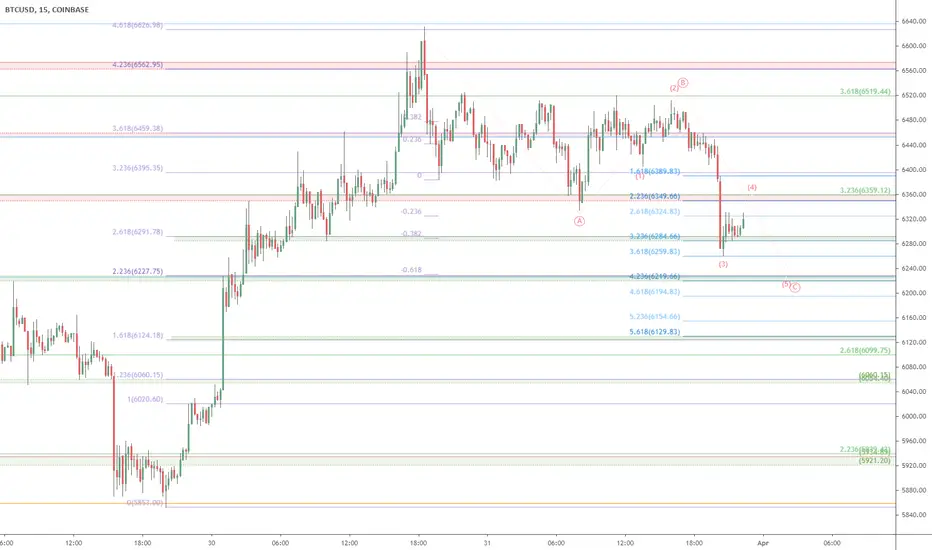
BTC topped as expect in last plot and now in retrace.
Thus far the retrace seems textbook ABC structure.
The turning points have been following fibs nicely.
$ 6220-28 is Minimum Expected for this pullback.
$ 6124-30 would be the next target if 6.2 breaks.
$ 6054-60 would be a scary but JUICY long entry.
Plotted EW wave is a GUESS, but the zones are SOLID.
Each zone will cause a reaction which is to be studied.
.
Previous Plots of this bounce:
Possible Bottom: $3850 Bottom Taggged
Bounce Update 1: $6950 top Plotted
Bounce Update 2: $5900 launch caught
Bounce Update 3: $6600 top Plotted
.
Older Plots catching every Major Turn:
9.2k Top Call
7.7k Retrace Target
10.5k Top call
9.7k Bounce <= mapped within $10
9k barrier Foretold <= Warning in Time
8475 Top Call <= Mapped within $5
Sub 7k Foreseen
Big Picture Fibs <= the 3 Fibs of Life
14k target call <=Perfect TP
10k target call
3.1k bottom call <=EXACT 2018 bottom
Note
Moment of Truth .
Note
Got past first resistance but 6220 still possible ==================================================================================
.
Note
Headed lower along with stocks.Equity markets declining since Asia session last night, and so has btc
2nd support around 6130 looks likely.
But blue fib seems to have lost control.
Need a closer look to see whats going on.
.
Zoom IN (3 min) and some observations regarding Blue Fib's influence
Blue 5.236 likely next target if blue fib maintains some influence
but lets see what new impulses occurred within the last few hours of action, below.
.
Zoom IN (1 min) with a possible "Pulse" fib of last leg down
Kind of like a ruler whose "inch" increment has been calibrated.
Now a Fib (red) on the big drop
-0.236 retracement (or +1.236 extension) is a very common overshoot of any sizeable push.
.
Zoom OUT (5 min) with new Red fib and blue pulse fib in context
we see the strong confluence around $6130 again.
All three fibs of relevance are often key ratios.
- blue 5.618 original impulse,
- blue 8.618 of pulse market,
- red -0.618 of last sharp drop.
.
SUMMARY:
- 1st target for wave C reached and breached.
- 2nd target around $6130 looks highly likely.
- we are still tightly correlated to stock markets.
- stocks look to be headed lower yet, so more down here too.
=============================================================================================
.
Note
wow, Explosion out of nowhere.But just smacked into a pretty strong resistance zone
=============================================================================================
.
the Golden Ratio is my Religion
the Trading View is my Nation
the Moderator Tag is my Flag
the Trading View is my Nation
the Moderator Tag is my Flag
Disclaimer
The information and publications are not meant to be, and do not constitute, financial, investment, trading, or other types of advice or recommendations supplied or endorsed by TradingView. Read more in the Terms of Use.
Disclaimer
The information and publications are not meant to be, and do not constitute, financial, investment, trading, or other types of advice or recommendations supplied or endorsed by TradingView. Read more in the Terms of Use.