⊣
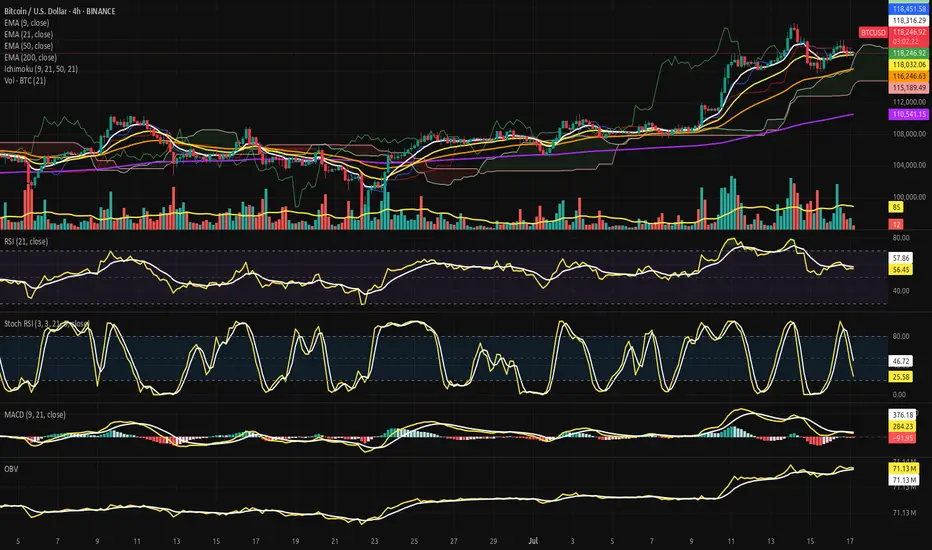
⟁ BTC/USD - BINANCE - (CHART: 4H) - (July 17, 2025).
◇ Analysis Price: $118,099.62.
⊣
⨀ I. Temporal Axis - Strategic Interval – (4H):
▦ EMA9 - (Exponential Moving Average - 9 Close):
∴ EMA9 is currently positioned at $118,286.83, marginally above the current price of $118,099.62;
∴ The slope of the EMA9 has begun to turn sideways-to-downward, indicating loss of short-term acceleration;
∴ The price has crossed below EMA9 within the last two candles, suggesting an incipient rejection of immediate bullish continuation.
✴️ Conclusion: Short-term momentum has weakened, positioning EMA 9 as immediate dynamic resistance.
⊢
▦ EMA21 - (Exponential Moving Average - 21 Close):
∴ EMA21 is measured at $118,018.67, positioned slightly below both price and EMA9, indicating a recent tightening of trend structure;
∴ The slope of EMA21 remains positive, preserving the medium-range bullish structure intact;
∴ EMA21 has been tested multiple times and held as support since July 15 - confirming tactical reliability as dynamic floor.
✴️ Conclusion: EMA21 stands as a critical pivot zone; any sustained breach would denote structural stress.
⊢
▦ EMA50 - (Exponential Moving Average - 50 Close):
∴ EMA50 is currently located at $116,240.85, well below current price action;
∴ The curve maintains a healthy positive inclination, affirming preservation of broader intermediate trend;
∴ No contact or proximity to EMA50 over the last 20 candles - indicating strong bullish detachment and buffer zone integrity.
✴️ Conclusion: EMA50 confirms medium-term bullish alignment; not yet challenged.
⊢
▦ EMA200 - (Exponential Moving Average - 200 Close):
∴ EMA200 stands at $110,539.69, forming the base of the entire 4H structure;
∴ The gradient is gradually rising, reflecting accumulation over a long time horizon;
∴ The distance between price and EMA200 reflects extended bullish positioning, yet also opens risk for sharp reversion if acceleration collapses.
✴️ Conclusion: Long-term structure remains bullish; early signs of overextension exist.
⊢
▦ Ichimoku Cloud - (9, 21, 50, 21):
∴ Price is currently above the Kumo (cloud), placing the pair within a bullish regime;
∴ Tenkan-sen (conversion) and Kijun-sen (base) lines show narrowing separation, suggesting momentum compression;
∴ Senkou Span A > Span B, and the cloud ahead is bullishly twisted, though thinning - indicating potential vulnerability despite structural advantage.
✴️ Conclusion: Bullish regime intact, but loss of momentum and cloud compression warrant caution.
⊢
▦ Volume + EMA21:
∴ Current volume for the latest candle is 3 BTC, compared to the EMA21 of 84 BTC;
∴ This indicates an extremely low participation phase, often associated with distribution zones or indecisive consolidation;
∴ Previous impulsive candles (July 15) reached well above 100 BTC - the current contraction is stark and strategically significant.
✴️ Conclusion: Absence of volume threatens trend continuation; energy depletion apparent.
⊢
▦ RSI - (21) + EMA9:
∴ RSI (21) is positioned at 55.73, marginally above neutral zone;
∴ EMA 9 of RSI is 57.71, crossing downward against RSI - bearish micro signal;
∴ No divergence is present versus price action - oscillator confirms current stagnation rather than exhaustion.
✴️ Conclusion: RSI losing strength above neutral; lacks momentum for breakout, but no capitulation.
⊢
▦ Stoch RSI - (3,3,21,9):
∴ %K is 21.44, %D is 45.34 - both pointing downward, in deacceleration phase;
∴ Recent rejection from overbought zone without full reset into oversold - signaling weak bullish thrust;
∴ Historical cycles show rhythmical reversals near current levels, but only with supportive volume, which is absent now.
✴️ Conclusion: Short-term momentum failed to sustain overbought breakout - micro-correction expected.
⊢
▦ MACD - (9, 21):
∴ MACD line is at -104.80, Signal line at 268.16 - large separation, histogram deeply negative;
∴ The bearish crossover occurred with declining volume, implying fading momentum rather than aggressive sell-off;
∴ No bullish divergence formed yet - continuation of correction remains technically favored.
✴️ Conclusion: MACD confirms trend exhaustion; no reversal in sight.
⊢
▦ OBV + EMA 9:
∴ OBV is 71.13M, perfectly aligned with its EMA9 - indicating equilibrium in volume flow;
∴ No directional bias in accumulation or distribution - flatlining suggests passive environment;
∴ Prior OBV uptrend has stalled since July 15 - reinforcing narrative of hesitation.
✴️ Conclusion: Institutional flow is neutral; no aggressive positioning detected.
⊢
🜎 Strategic Insight - Technical Oracle: The current price structure presents a classic post-impulse compression configuration within a preserved bullish environment. Despite the higher timeframe alignment, multiple short-term indicators exhibit tactical dissonance and signs of momentum decay. This inconsistency reflects a market caught between structural optimism and tactical hesitation.
♘ Key strategic signals - Structural Alignment:
∴ All major EMA's (9, 21, 50, 200) remain stacked in bullish order with no bearish crossovers imminent;
∴ Price remains above the Ichimoku Cloud and above EMA50 - both confirming structural dominance by buyers.
♘ Momentum Degradation:
∴ RSI (21) is drifting below its EMA9, weakening the momentum required for further upside continuation;
∴ Stochastic RSI has rolled over aggressively, failing to reach oversold before reversing - mid-cycle weakness is confirmed.
♘Volume Collapse:
∴ The current volume profile is critically weak - 3 Bitcoin against an average of 84 Bitcoins (EMA21);
∴ Price attempting to sustain above EMA's with no conviction signals distribution or passivity.
♘ MACD & OBV:
∴ MACD histogram remains deep in negative territory, and no bullish crossover is visible;
∴ OBV is flat - neither accumulation nor distribution dominates, leaving directional thrust suspended.
✴️ Oracle Insight:
∴ The technical field is Structurally Bullish, but Tactically Compressed.
∴ No breakout should be expected unless volume decisively returns above baseline (84 Bitcoins EMA);
∴ Below $117,800, the structure risks transition into a corrective phase;
∴ Above $118,450, potential trigger zone for bullish extension if accompanied by volume surge.
♘ Strategic posture:
∴ Wait-and-observe regime activated;
∴ No entry condition satisfies both structure and momentum at present;
∴ Tactical neutrality is advised until confirmation.
⊢
∫ II. On-Chain Intelligence - (Source: CryptoQuant):
▦ Exchange Reserve - (All Exchanges):
∴ The total Bitcoin reserves held on all exchanges continue a sharp and uninterrupted decline, now at ~2.4M BTC, down from over 3.4M in mid-2022;
∴ This downtrend has accelerated particularly after January 2025, with a visible drop into new lows - no accumulation rebound observed;
∴ Historically, every prolonged depletion of exchange reserves correlates with structural bullish setups, as supply becomes increasingly illiquid.
✴️ Conclusion: On-chain supply is structurally diminishing, confirming long-term bullish regime intact - mirrors technical EMA alignment.
⊢
▦ Fund Flow Ratio - (All Exchanges):
∴ Current Fund Flow Ratio stands at 0.114, which is well below historical danger thresholds seen near 0.20-0.25 during local tops;
∴ The ratio has remained consistently low throughout the 2025 uptrend, indicating that on-chain activity is not directed toward exchange-based selling;
∴ Spikes in this indicator tend to precede local corrections - but no such spike is currently present, reinforcing the notion of non-threatening capital flow.
✴️ Conclusion: Capital is not rotating into exchanges for liquidation - volume weakness seen in 4H chart is not linked to sell intent.
⊢
▦ Miners' Position Index - (MPI):
∴ The MPI sits firmly below the red threshold of 2.0, and currently ranges in sub-neutral levels (~0.5 and below);
∴ This suggests that miners are not engaging in aggressive distribution, and are likely retaining Bitcoin off-exchange;
∴ Sustained low MPI readings during price advances confirm alignment with institutional and long-term accumulation behavior.
✴️ Conclusion: Miner behavior supports structural strength - no mining-induced supply pressure present at this stage.
⊢
🜎 Strategic Insight - On-Chain Oracle:
∴ Across the three strategic indicators, no on-chain evidence supports short-term weakness;
∴ Supply is declining - (Exchange Reserve ↓);
∴ Funds are not preparing for exit - (Flow Ratio stable);
∴ Miners are not selling - (MPI subdued).
✴️ This constellation reinforces the thesis of Structural Bullishness with Tactical Compression, and suggests that any pullback is not backed by foundational stress.
⊢
𓂀 Stoic-Structural Interpretation:
∴ The multi-timeframe EMA stack remains intact and aligned - (9 > 21 > 50 > 200);
∴ Price floats above Ichimoku Cloud, and above EMA21 support, confirming elevated positioning within a macro bull channel;
∴ On-chain metrics confirm supply contraction, miner retention, and absence of fund rotation toward exchanges - structure remains sovereign;
∴ RSI - (21) slips under its EMA9 with low amplitude, indicating absence of energetic flow;
∴ Stoch RSI fails to reset fully and points downward - suggesting premature momentum decay;
∴ MACD histogram remains negative, while volume is significantly beneath EMA baseline (3 BTC vs 84 BTC);
∴ Price faces resistance at Kijun-sen ($118.451), acting as tactical ceiling; no breakout signal detected.
⊢
✴️ Interpretatio Finalis:
∴ Structural integrity remains unshaken - the architecture is bullish;
∴ Tactically, however, the battlefield is fogged - silence reigns in volume, hesitation in oscillators;
∴ A true continuation requires volume resurrection and resolution above $118,450. Until then, neutrality governs the edge.
⊢
⧉
Cryptorvm Dominvs · ⚜️ MAGISTER ARCANVM ⚜️ · Vox Primordialis
⌬ - Wisdom begins in silence. Precision unfolds in strategy - ⌬
⧉
⊢
Note
⊢🔴 ARCANVM SIGNAL CONFIRMED - Tactical Inflow Spike Detected - (July 17, 2025).
▦ Exchange Inflow Total - (All Exchanges):
∴ Detected inflow: 47,782 BTC, sharply surpassing the tactical threshold of +5,000 BTC;
∴ This value exceeds the structural EMA-30 baseline (~3,200 BTC) by more than +1,400%, confirming a major anomaly;
∴ Such inflows are historically correlated with liquidity reallocation, distribution setups, or early phases of sell-side strategy - particularly when volume on charts is otherwise silent.
✴️ Conclusion: Structural On-Chain Spike Detected - The equilibrium has been breached, requires heightened monitoring for short-term volatility or liquidity extraction.
⊢
✴️ Recommendation: No directional move is implied yet, but this overrules the tactical neutrality from earlier if sustained. Should this inflow consolidate on-chain or on order books, the Cloud Gate compression may shift into Sell-Side Liquidity Event.
⊢
✠
Ritvs Logicæ in Terræ Chaos;
Nihil Tumultvs. Nihil Vanitatis. Tantum Silentivm, Structvra et Exsecutio.
𓂀 Vbi Volatilitas Disciplinam Tangit - Ibi Sto.
⩘ Porta Solum Aperitur Stantibvs in Silentio.
✠
Ritvs Logicæ in Terræ Chaos;
Nihil Tumultvs. Nihil Vanitatis. Tantum Silentivm, Structvra et Exsecutio.
𓂀 Vbi Volatilitas Disciplinam Tangit - Ibi Sto.
⩘ Porta Solum Aperitur Stantibvs in Silentio.
✠
Related publications
Disclaimer
The information and publications are not meant to be, and do not constitute, financial, investment, trading, or other types of advice or recommendations supplied or endorsed by TradingView. Read more in the Terms of Use.
✠
Ritvs Logicæ in Terræ Chaos;
Nihil Tumultvs. Nihil Vanitatis. Tantum Silentivm, Structvra et Exsecutio.
𓂀 Vbi Volatilitas Disciplinam Tangit - Ibi Sto.
⩘ Porta Solum Aperitur Stantibvs in Silentio.
✠
Ritvs Logicæ in Terræ Chaos;
Nihil Tumultvs. Nihil Vanitatis. Tantum Silentivm, Structvra et Exsecutio.
𓂀 Vbi Volatilitas Disciplinam Tangit - Ibi Sto.
⩘ Porta Solum Aperitur Stantibvs in Silentio.
✠
Related publications
Disclaimer
The information and publications are not meant to be, and do not constitute, financial, investment, trading, or other types of advice or recommendations supplied or endorsed by TradingView. Read more in the Terms of Use.