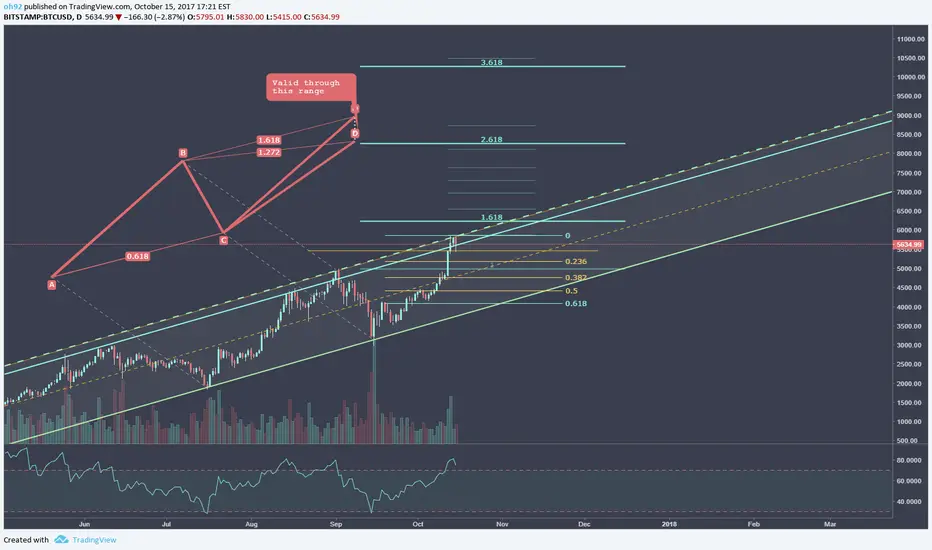
BTC has once again tested the top of its upward channel. As history tends to repeat itself, one must think we will see some sort of retracement at this level. However, during BTC's bull run in August, the bulls were actually able to push through the upward channel momentarily. This caused us to form the extended channel that we are now in. Meaning it is quite possible we will do this again, possibly taking us up to the 1.618 level and beyond.
Key factors for this is the current market sentiment.
Bitcoin has officially gone mainstream, leading us to a whole new range of investors. Therefore the demand for bitcoin has skyrocketed, and we all know the effect of that.
Not only are there new investors, but Bitcoin will once again be forking this month. Therefore many people are swapping their alts for BTC to get those free coins once again.
However, we must keep in mind that we are currently testing the upward channel which just happens to mark the completion of a possible ABCD pattern.
If this pattern holds true, we will likely see a larger retracement. If so, I would watch out for upward continuations at the gold fib levels show above.
This chart is nothing other than an update of my previous chart posted on Aug 31, 2017.
DISCLAIMER:
Please note I am only providing my own trading information for your benefit and insight to my trading techniques, you should do your own due diligence and not take this information as a trade signal.
Note
Note
Once again we are at the top of the channel. Be very cautious, the completion of another ABCD pattern sets at about 6050.Note
Beware of the Flag. I'm reamining bullish until we break the bottom of the flag. + here is a little humor :) GL!
Note
just an reminder... The ABCD still remains a possibility unless we pass the 1.618. Don't get greedy!Note
Pennants are usually a sign of a continuation. However this is BTC, so wait for a break in either direction Trade closed: target reached
could see a bounce here, but waiting on confirmationNote
If the bounce fails, next target is $5,400Creator of DepthHouse Indicators on TradingView!
↣ depthhouse.com/
↣ depthhouse.com/
Related publications
Disclaimer
The information and publications are not meant to be, and do not constitute, financial, investment, trading, or other types of advice or recommendations supplied or endorsed by TradingView. Read more in the Terms of Use.
Creator of DepthHouse Indicators on TradingView!
↣ depthhouse.com/
↣ depthhouse.com/
Related publications
Disclaimer
The information and publications are not meant to be, and do not constitute, financial, investment, trading, or other types of advice or recommendations supplied or endorsed by TradingView. Read more in the Terms of Use.