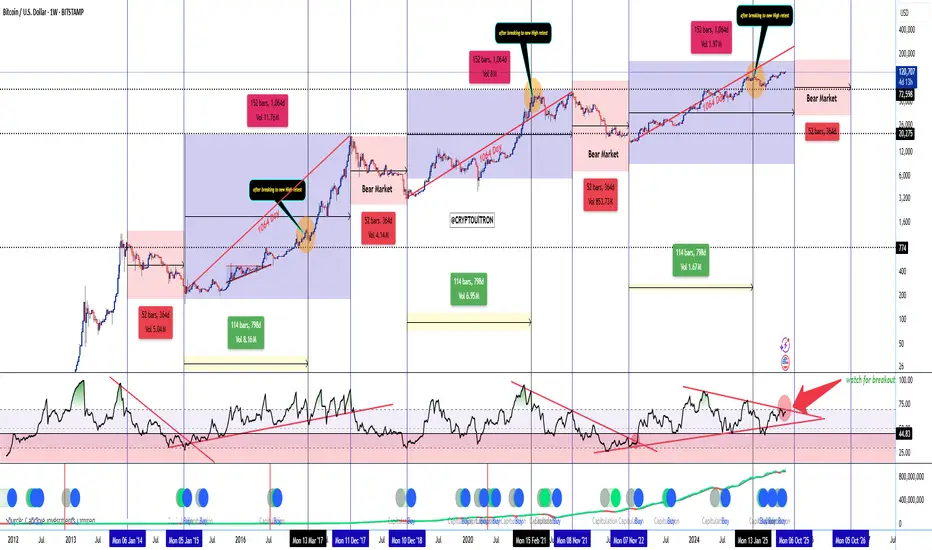
📊 BTC 1W Cycle Map — 1064-Day Cadence Intact
🎯 Top window: Week of 06 Oct ’25 (± 1–2 weeks)
🧩 Cycle structure (from chart):
📈 RSI setup:
🔍 Key chart signals:
📌 My read:
⏳ Post-top expectations:
~1 year of decline/mean reversion → likely retrace to prior breakout demand (mid-70s to low-80s).
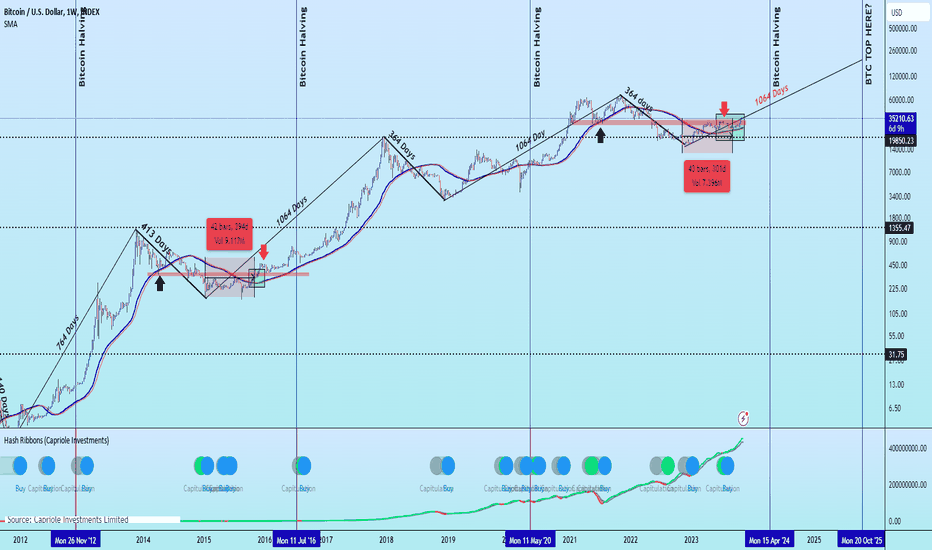
Chart from 2023
🎯 Top window: Week of 06 Oct ’25 (± 1–2 weeks)
🧩 Cycle structure (from chart):
- 1064-day rhythm to macro top has played out in 2013, 2017, and 2021.
- From the Nov ’22 cycle low, the next 1064d lands on Oct ’25 → that’s my projected cycle top zone.
- Each cycle shows ATH break → retest → terminal leg before topping. Orange circles = retests. We’ve completed ours.
- Bear markets have been rhythmic: ~52 weeks / 364 bars of decline post-top. Marked in red for all past cycles.
📈 RSI setup:
- 1W RSI downtrend break has always preceded the final blow-off leg.
- Currently coiling just under that trendline (big red arrow). A confirmed breakout is my ignition trigger.
🔍 Key chart signals:
- Blue/green capitulation buy dots (hash ribbon + cycle models) historically cluster before major legs up, not at tops.
- Volume cycles also show ~114 weeks (798 days) of expansion phases between retest and top.
📌 My read:
- If RSI fails and price closes <95–100k weekly, I’ll treat it as an early-top scenario.
⏳ Post-top expectations:
~1 year of decline/mean reversion → likely retrace to prior breakout demand (mid-70s to low-80s).
Chart from 2023
Disclaimer
The information and publications are not meant to be, and do not constitute, financial, investment, trading, or other types of advice or recommendations supplied or endorsed by TradingView. Read more in the Terms of Use.
Disclaimer
The information and publications are not meant to be, and do not constitute, financial, investment, trading, or other types of advice or recommendations supplied or endorsed by TradingView. Read more in the Terms of Use.