Unlike the medium/ long-term projections that I usually make, I decided that during this time of Bitcoin's consolidation, it would be useful to display the short-term perspective. So this study focuses entirely on the 4H chart.
** Before we start, please support this idea with your likes and comments, it is the best way to keep it relevant and support me. **
** The Channel Up **
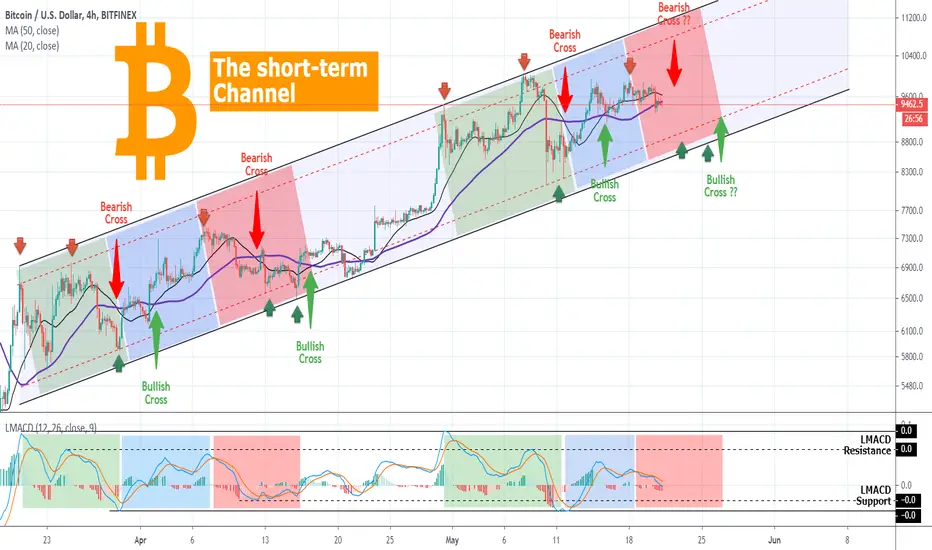
Since March 20, Bitcoin has been trading within a Channel Up pattern on the 4H chart. The rise has been strong but steady and as you see on the chart we can divide it into stages using the MA20 and MA50.
- The Green Stage starts at the beginning of the Channel Up has two Higher High touches and ends on a Higher Low touch and a MA20/MA50 Bearish Cross.
- The Blue Stage starts where the Green ends with the Bearish Cross, it forms a MA20/MA50 Bullish Cross roughly in the middle and ends with a Higher High.
- The Red Stage starts where the Blue ends on the Higher High, forms a MA20/MA50 Bearish cross in the middle and ends with two Higher Lows and a MA20/MA50 Bullish Cross.
So far we see a similar development after the April 30 Higher High: Green Stage with two Higher Highs a Higher Low and MA20/MA50 Bearish Cross, Blue Stage with MA20/MA50 Bullish Cross and a Higher High and at the moment the price is on the Red Stage about to make the Bearish Cross.
** The LMACD **
A similar staging can be applied on the LMACD, our very accurate trend indicator throughout the year, especially on short time-frames. The Green Stage has two Lower Highs and two Lower Lows. The Blue Stage is the recovery with Higher Lows, while the Red Stage is bearish with a drop and consolidation until recovery.
** Conclusion **
If this pattern holds then we should expect BTC to form a MA20/MA50 Bearish Cross, make contact with the Higher Low trend-line of the Channel Up and form a MA20/MA50 Bullish Cross to kick-start the recovery.
Do you think this pattern is accurate and will play out? Is it too risky to look on the short-term while trading so close to the 9-month $10500 Resistance after a hyper aggressive 2-month rally with more than +100% in gains? Feel free to share your work and let me know in the comments section!
Please like, subscribe and share your ideas and charts with the community!
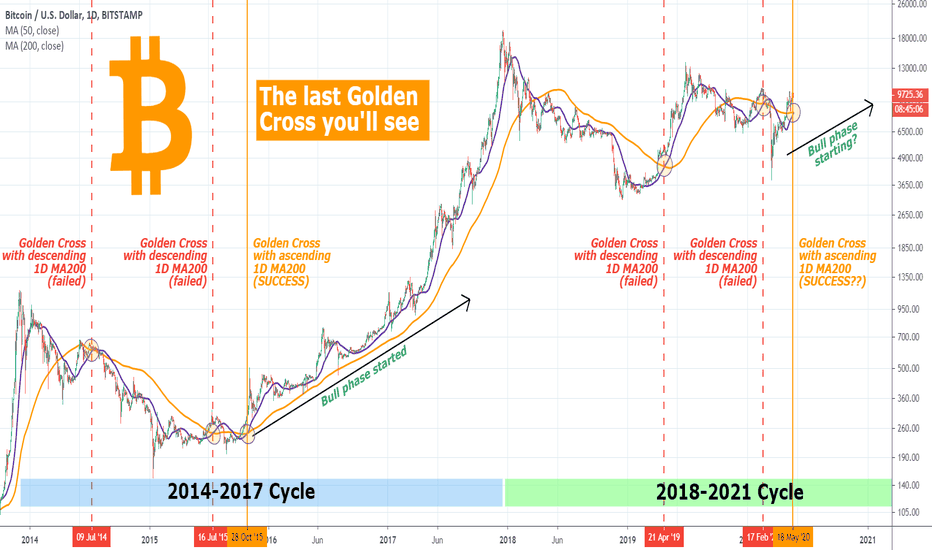
** BONUS MATERIAL my most recent long-term view:
** Before we start, please support this idea with your likes and comments, it is the best way to keep it relevant and support me. **
** The Channel Up **
Since March 20, Bitcoin has been trading within a Channel Up pattern on the 4H chart. The rise has been strong but steady and as you see on the chart we can divide it into stages using the MA20 and MA50.
- The Green Stage starts at the beginning of the Channel Up has two Higher High touches and ends on a Higher Low touch and a MA20/MA50 Bearish Cross.
- The Blue Stage starts where the Green ends with the Bearish Cross, it forms a MA20/MA50 Bullish Cross roughly in the middle and ends with a Higher High.
- The Red Stage starts where the Blue ends on the Higher High, forms a MA20/MA50 Bearish cross in the middle and ends with two Higher Lows and a MA20/MA50 Bullish Cross.
So far we see a similar development after the April 30 Higher High: Green Stage with two Higher Highs a Higher Low and MA20/MA50 Bearish Cross, Blue Stage with MA20/MA50 Bullish Cross and a Higher High and at the moment the price is on the Red Stage about to make the Bearish Cross.
** The LMACD **
A similar staging can be applied on the LMACD, our very accurate trend indicator throughout the year, especially on short time-frames. The Green Stage has two Lower Highs and two Lower Lows. The Blue Stage is the recovery with Higher Lows, while the Red Stage is bearish with a drop and consolidation until recovery.
** Conclusion **
If this pattern holds then we should expect BTC to form a MA20/MA50 Bearish Cross, make contact with the Higher Low trend-line of the Channel Up and form a MA20/MA50 Bullish Cross to kick-start the recovery.
Do you think this pattern is accurate and will play out? Is it too risky to look on the short-term while trading so close to the 9-month $10500 Resistance after a hyper aggressive 2-month rally with more than +100% in gains? Feel free to share your work and let me know in the comments section!
Please like, subscribe and share your ideas and charts with the community!
** BONUS MATERIAL my most recent long-term view:
👑Best Signals (Forex/Crypto+70% accuracy) & Account Management (+20% profit/month on 10k accounts)
💰Free Channel t.me/tradingshotglobal
🤵Contact info@tradingshot.com t.me/tradingshot
🔥New service: next X100 crypto GEMS!
💰Free Channel t.me/tradingshotglobal
🤵Contact info@tradingshot.com t.me/tradingshot
🔥New service: next X100 crypto GEMS!
Disclaimer
The information and publications are not meant to be, and do not constitute, financial, investment, trading, or other types of advice or recommendations supplied or endorsed by TradingView. Read more in the Terms of Use.