Yesterday’s analysis/position: 0.382 FIB and 9 on the TD sell setup vs bullish cloud. Expected a pullback or days of consolidation to get us back to the 12 day EMA before we could break $8,500. Identified death cross on 30 and 50 week MA’s. Remain bearish overall, but wasn’t confident that was the top of the bounce. Currently no position.
Patterns: Broke out of a triangle on the log chart. Higher lows and lower highs are forming a trend.
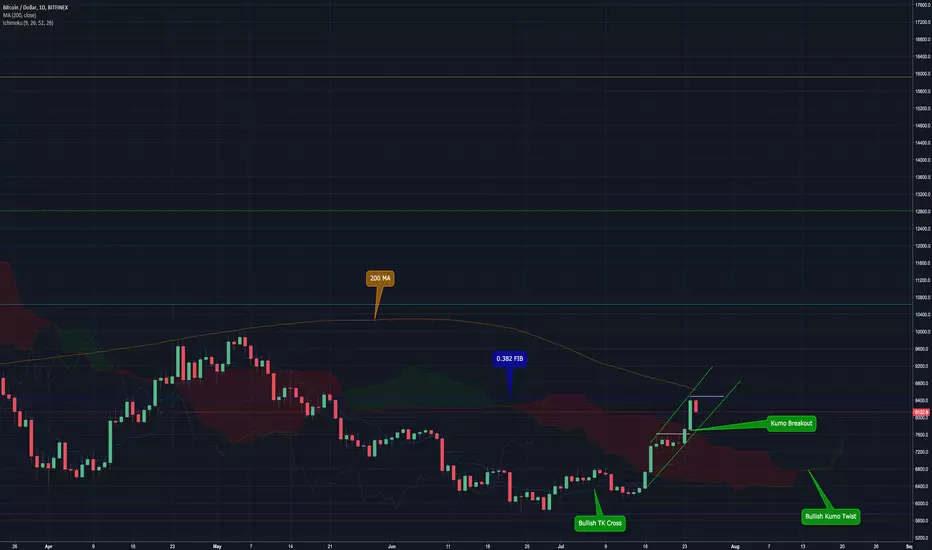
Horizontal support and resistance: r: $8,491 s: $7,591
LONG:SHORT: 58%:41% | Shorts really picked up in the last 1h. Could potentially see a h:s confirming on the 1h chart.
Funding Rates: Longs pay shorts 0.05%
12 & 26 EMA’s (calculate % difference): 12& 26: +20.53% making bullish crossover but the price is way too far away.
50 & 128 MA’s: 128:+7.23% 50: +20.99% | Most time we have spent above these MA’s in this bear market. 200 MA was almost tested for the first time since May 6th. Will be very interested to see if it can breakthrough it.
FIB’s: 0.382 = $8,448 0.236 = $5,786
Candlestick analysis: Daily Tweezer top.
Ichimoku Cloud: Daily could is at $7,604 which it was prior resistance it is a logical area for the price to retest for support. The only thing that isn’t fully bullish about the daily cloud is the Lagging Span isn’t above the price.
TD’ Sequential: Green 1 following the 9, would need to trade below $7,420 to get a price flip.
Visible Range: Largest volume profile in the last 24 hours is $8,164 - $8,225. That area is currently being tested for resistance. The 2nd, largest volume profile in the last 5 days is $8,174 - $8,225 which is currently being tested for resistance. $7,720 is the largest during the last 5 days. There is very good volume at $7,400 and $6,600 and those areas should serve as good support.
BTC Price Spreadsheet: 12h: -2.38% 24h: -0.36% 1w: +11.62% 2w: +28.43% 1m: +30.35%
Bollinger Bands: Just pulled back inside daily band. The last candle was the farthest we have been outside the daily band in this entire bear market.
Trendline: Bull trendline connects 7/16 and 7/23
Daily Trend: Bearish
Fractals: Down: $7,208 UP: $8,650
On Balance Volume: Healthy/no div’
Chaikin Money Flow: Approaching 0.05 on weekly. Trending upward nicely on daily.
Buy/Sell Sentiment on Trading View (counter trade): Oscillators: Neutral MA’s: Strong Buy Summary: Buy
RSI: Retesting 70 on daily and just broke 50 on the weekly
Stoch: Weekly looks very good. Daily is overbought, but it can stay that way for a month+
Summary: Are we briefly pulling back before continuing the rally to $10,000 or was this the top of the dead cat bounce? It’s very tough to say and that is why I will continue to stay out of the market while waiting for further development. There will be strong support at $7,400 - $7,600 and $6,800. I will be very interested to see what happens after that. Do we breakthrough $8,500 with conviction or create a lower local high under a death cross? I remain a bear as long as we are under the 200 MA and there are bearish crossovers on the longer term MA’s.
Patterns: Broke out of a triangle on the log chart. Higher lows and lower highs are forming a trend.
Horizontal support and resistance: r: $8,491 s: $7,591
LONG:SHORT: 58%:41% | Shorts really picked up in the last 1h. Could potentially see a h:s confirming on the 1h chart.
Funding Rates: Longs pay shorts 0.05%
12 & 26 EMA’s (calculate % difference): 12& 26: +20.53% making bullish crossover but the price is way too far away.
50 & 128 MA’s: 128:+7.23% 50: +20.99% | Most time we have spent above these MA’s in this bear market. 200 MA was almost tested for the first time since May 6th. Will be very interested to see if it can breakthrough it.
FIB’s: 0.382 = $8,448 0.236 = $5,786
Candlestick analysis: Daily Tweezer top.
Ichimoku Cloud: Daily could is at $7,604 which it was prior resistance it is a logical area for the price to retest for support. The only thing that isn’t fully bullish about the daily cloud is the Lagging Span isn’t above the price.
TD’ Sequential: Green 1 following the 9, would need to trade below $7,420 to get a price flip.
Visible Range: Largest volume profile in the last 24 hours is $8,164 - $8,225. That area is currently being tested for resistance. The 2nd, largest volume profile in the last 5 days is $8,174 - $8,225 which is currently being tested for resistance. $7,720 is the largest during the last 5 days. There is very good volume at $7,400 and $6,600 and those areas should serve as good support.
BTC Price Spreadsheet: 12h: -2.38% 24h: -0.36% 1w: +11.62% 2w: +28.43% 1m: +30.35%
Bollinger Bands: Just pulled back inside daily band. The last candle was the farthest we have been outside the daily band in this entire bear market.
Trendline: Bull trendline connects 7/16 and 7/23
Daily Trend: Bearish
Fractals: Down: $7,208 UP: $8,650
On Balance Volume: Healthy/no div’
Chaikin Money Flow: Approaching 0.05 on weekly. Trending upward nicely on daily.
Buy/Sell Sentiment on Trading View (counter trade): Oscillators: Neutral MA’s: Strong Buy Summary: Buy
RSI: Retesting 70 on daily and just broke 50 on the weekly
Stoch: Weekly looks very good. Daily is overbought, but it can stay that way for a month+
Summary: Are we briefly pulling back before continuing the rally to $10,000 or was this the top of the dead cat bounce? It’s very tough to say and that is why I will continue to stay out of the market while waiting for further development. There will be strong support at $7,400 - $7,600 and $6,800. I will be very interested to see what happens after that. Do we breakthrough $8,500 with conviction or create a lower local high under a death cross? I remain a bear as long as we are under the 200 MA and there are bearish crossovers on the longer term MA’s.
emasar Indicator is available for purchase at alphanalysis.io/product/emasar/
Disclaimer
The information and publications are not meant to be, and do not constitute, financial, investment, trading, or other types of advice or recommendations supplied or endorsed by TradingView. Read more in the Terms of Use.