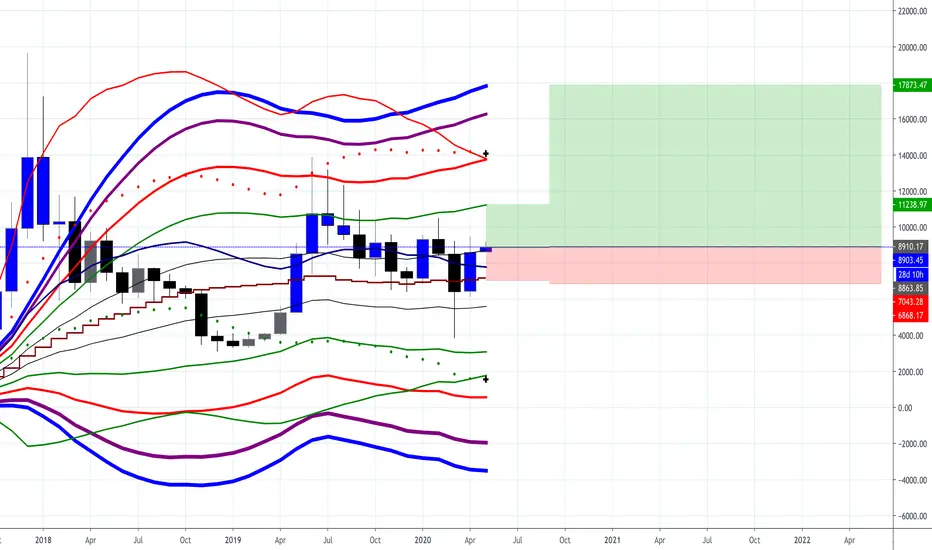
My reasons to be bullish are as follows:
Target: $11238 - $17873 as shown.
- Reason 1: The TD9 got invalidated. We are at TD2
- Reason 2: My super algorithm still saying bullish. It is a bit late for bullish entry. Next few reasons will clear why I am bullish
- Reason3: We have a green background from the bullish bearish indicator from me. More reasons coming below
- Reason4: (Demand & Supply) The price has clearly reached the 61.8fib. It went from 6718 to 9486 (fib to fib). Then it retested the demand zone. In the demand zone, the bull army has shown strong demand by ensuring the wicks are progressively higher and higher. The suppliers have been defending heavily. However, the price is progressively going up making "somewhat" of an HL-HH kinda trend. It shows that the supply is getting weaker. There is still a lot of supply of exhaust.
- Reason 5: The halving is nearby in. If the price can make a good move up, then the FOMO will be immense. It can become such a self-fulfilling prophecy that it becomes the reason why it broke out. And, hence it becomes headline in many newspapers. Imagine if such a situation happens, the herd will come back in. The herd is always hungry for profits. And whales know very well how to unload their bags at a high price above ATH (20k). So if a break happens, imagine this going parabolic.
- Parabolic SAR is still bullish and the daily is printed higher high and higher low bar by bar
- Wikson Relative Price Channel is in green bullish territory.
- This shows clearly that 10487 maybe next. I believe more is on the horizon.
- Reason 9: My free JB indicator showing clear buy signal (still a few more hours to go for end). However, look at where it printed the last sell or buy.
- Reason 10: Green to red to green to red . ATR .
Showing 9855 is possibly next. I imagine more. Bullish it is showing
- (ichi) Self-explanatory as we all use it. It is bullish
- Reason 12: 2D ichi shows that price already entered the cloud. Will the cloud break the price and let us go towards ATH
- Reason: Daily Ichi shows that price already is above tenkan and Kijun. Tenkan > Kijun. The only thing remains is a bit more push until both tenkan & kijun goes above cloud. A little more push. Patience & good risk management is everything in trading
- Reason 14: This is Coral Trend Indicator from Lazy Bear. It shows green bullish background. Look at some of the previous green backgrounds. 💰
- Reason 15: Using the Bitstamp, here is my crude analysis for Hash Ribbon Buy signal for weekly timeframe
1st Buy: 49% potential gain
2nd Buy: 167% potential gain
3rd Buy: 4798% potential gain
4th Buy: 41% potential gain
5th Buy: 209% potential gain
6th Buy: 3143% potential gain
7th Buy: 294% potential gain
8th Buy: 54% potential gain
We had a confirmed 9th Buy signal this week. Only future will tell how much gain/loss it will give this time.
Target: $11238 - $17873 as shown.
For guides on how to use the Aladdin indicator or how to buy it, please check joy-bangla.gitbook.io/aladdin/
Disclaimer
The information and publications are not meant to be, and do not constitute, financial, investment, trading, or other types of advice or recommendations supplied or endorsed by TradingView. Read more in the Terms of Use.