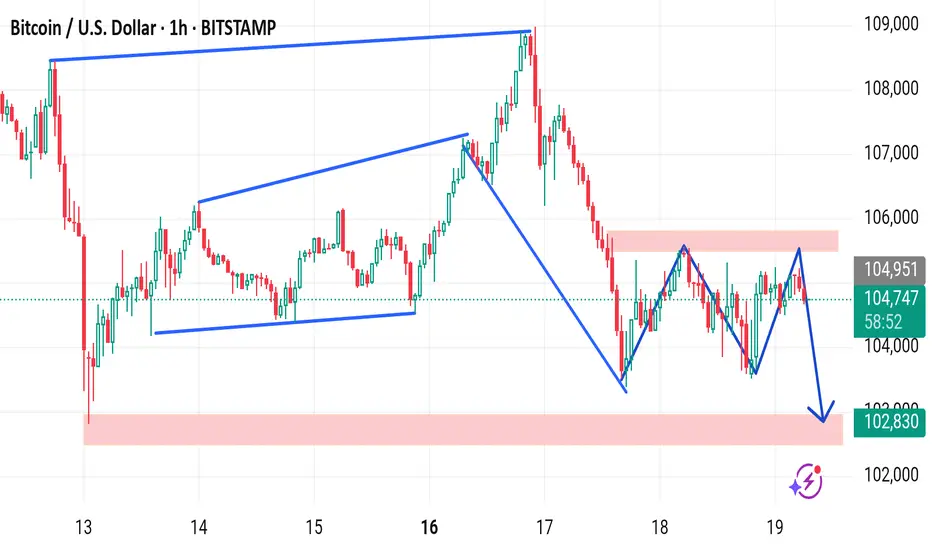
The chart you've shared is a 1-hour BTC/USD (Bitcoin to USD) chart from Bitstamp, and it illustrates several technical patterns and a possible bearish setup:
Key Observations:
1. Rising Wedge Pattern (Bearish):
From June 13–17, a rising wedge pattern formed (higher highs, higher lows, converging trendlines).
This pattern broke down sharply around June 17, which typically signals bearish momentum.
2. Bear Flag/Range Consolidation:
After the drop, BTC entered a sideways consolidation (highlighted in a red box), forming a rectangular range between ~104,950 resistance and ~102,830 support.
This could be interpreted as a bear flag or a distribution phase, suggesting continuation of the prior downtrend.
3. Bearish Projection:
The blue zig-zag line with the downward arrow suggests the analyst expects a break below the 102,830 support.
If this happens, further downside is likely. The measured move target could be projected from the height of the range (~2,100 points) below the breakdown point.
Summary:
Short-Term Bias: Bearish
Key Support: 102,830
Key Resistance: 104,950
Next Move: Breakdown below 102,830 could lead to a drop toward ~100,700 or lower, if the bear flag confirms.
Would you like a trading idea or stop-loss/take-profit suggestions based on this pattern?
t.me/+EQ88IkMSUvQwMGJk
Join telegram channel free
t.me/+EQ88IkMSUvQwMGJk
Join telegram channel free
t.me/+EQ88IkMSUvQwMGJk
Disclaimer
The information and publications are not meant to be, and do not constitute, financial, investment, trading, or other types of advice or recommendations supplied or endorsed by TradingView. Read more in the Terms of Use.
t.me/+EQ88IkMSUvQwMGJk
Join telegram channel free
t.me/+EQ88IkMSUvQwMGJk
Join telegram channel free
t.me/+EQ88IkMSUvQwMGJk
Disclaimer
The information and publications are not meant to be, and do not constitute, financial, investment, trading, or other types of advice or recommendations supplied or endorsed by TradingView. Read more in the Terms of Use.