🔹Technical Analysis: BTC/USD - 4H Chart
▪️Trend Structure & Breakout Retest:
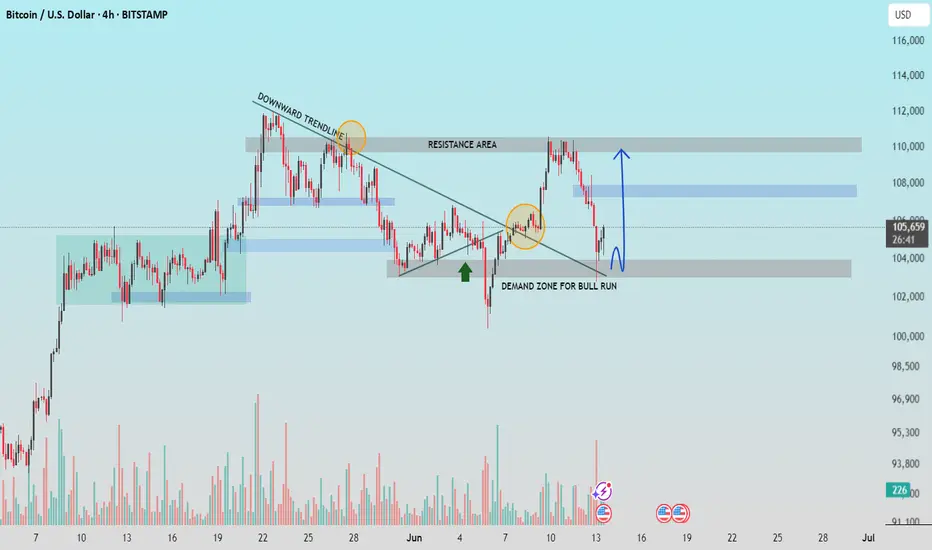
Bitcoin has broken above a long-standing downward trendline, signaling a shift in momentum. After a strong bullish impulse, price is now pulling back to retest the breakout area near the $104,000-$105,000 zone.
▪️Key Levels:
▫️ Demand Zone (Support): $103,800 - $105,200
▫️ Resistance Area: $109,500 - $110,500
▫️ Intermediate Supply Zone: $107,500 - $108,800
▪️Outlook & Scenarios:
▫️Bullish Scenario: A successful retest of the demand zone may confirm bullish continuation toward $108K and $110K. Watch for a bullish engulfing candle or volume spike as entry confirmation.
▫️Invalidation: A sustained drop below $103,800 would weaken the bullish setup and open the door for further downside.
▪️Bias: Cautiously bullish while price holds above the demand zone and trendline.
🔹Community Insight:
If you find this analysis helpful in your trading journey, feel free to share your thoughts or questions in the comments. Let’s work together to maintain a disciplined, technical approach to the markets.
▪️Follow for regular updates and trade setups.
▪️Trend Structure & Breakout Retest:
Bitcoin has broken above a long-standing downward trendline, signaling a shift in momentum. After a strong bullish impulse, price is now pulling back to retest the breakout area near the $104,000-$105,000 zone.
▪️Key Levels:
▫️ Demand Zone (Support): $103,800 - $105,200
▫️ Resistance Area: $109,500 - $110,500
▫️ Intermediate Supply Zone: $107,500 - $108,800
▪️Outlook & Scenarios:
▫️Bullish Scenario: A successful retest of the demand zone may confirm bullish continuation toward $108K and $110K. Watch for a bullish engulfing candle or volume spike as entry confirmation.
▫️Invalidation: A sustained drop below $103,800 would weaken the bullish setup and open the door for further downside.
▪️Bias: Cautiously bullish while price holds above the demand zone and trendline.
🔹Community Insight:
If you find this analysis helpful in your trading journey, feel free to share your thoughts or questions in the comments. Let’s work together to maintain a disciplined, technical approach to the markets.
▪️Follow for regular updates and trade setups.
Trade active
from 105k$Note
trade running 200 pips+Note
Trade closed: target reached
Related publications
Disclaimer
The information and publications are not meant to be, and do not constitute, financial, investment, trading, or other types of advice or recommendations supplied or endorsed by TradingView. Read more in the Terms of Use.
Related publications
Disclaimer
The information and publications are not meant to be, and do not constitute, financial, investment, trading, or other types of advice or recommendations supplied or endorsed by TradingView. Read more in the Terms of Use.