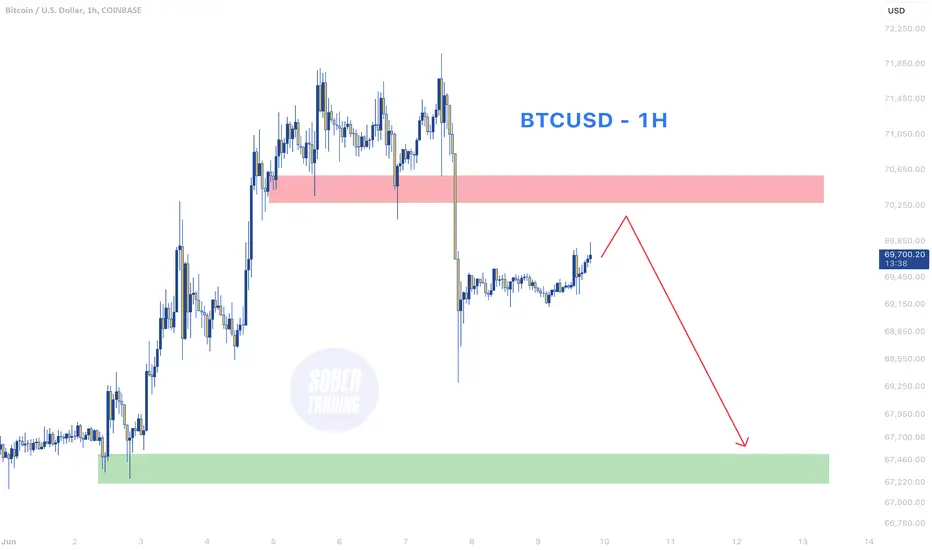
On the BTC/USD 1-hour chart, Bitcoin faces resistance around $70,200 and may pull back to hunt stops below the recent low of $68,300. This suggests a potential short-term decline before any further upward movement.
Note
As predicted, Bitcoin in the 1-hour timeframe reached the resistance zone outlined in my previous analysis. After touching this critical zone, it followed the anticipated pattern and is now showing signs of a decline.Note
🎉 Congratulations, everyone! 🎉 Our analysis for Bitcoin (BTC/USD) has played out beautifully! As predicted, BTC reached the resistance zone around $70,300 and has started its decline, breaking out of the ascending channel. 📉 🥳 Great job following the plan and stay tuned for more accurate calls like this! 🚀🚀 Join Our Free Telegram Channels!
📈 Crypto – Bitcoin daily analysis & exclusive Altcoins opportunities!
t.me/Sober_Trading
💵 Gold & Forex – Expert insights & accurate signals!
t.me/Sober_Forex
🎯 Stay ahead with free updates!
📈 Crypto – Bitcoin daily analysis & exclusive Altcoins opportunities!
t.me/Sober_Trading
💵 Gold & Forex – Expert insights & accurate signals!
t.me/Sober_Forex
🎯 Stay ahead with free updates!
Related publications
Disclaimer
The information and publications are not meant to be, and do not constitute, financial, investment, trading, or other types of advice or recommendations supplied or endorsed by TradingView. Read more in the Terms of Use.
🚀 Join Our Free Telegram Channels!
📈 Crypto – Bitcoin daily analysis & exclusive Altcoins opportunities!
t.me/Sober_Trading
💵 Gold & Forex – Expert insights & accurate signals!
t.me/Sober_Forex
🎯 Stay ahead with free updates!
📈 Crypto – Bitcoin daily analysis & exclusive Altcoins opportunities!
t.me/Sober_Trading
💵 Gold & Forex – Expert insights & accurate signals!
t.me/Sober_Forex
🎯 Stay ahead with free updates!
Related publications
Disclaimer
The information and publications are not meant to be, and do not constitute, financial, investment, trading, or other types of advice or recommendations supplied or endorsed by TradingView. Read more in the Terms of Use.