Summary
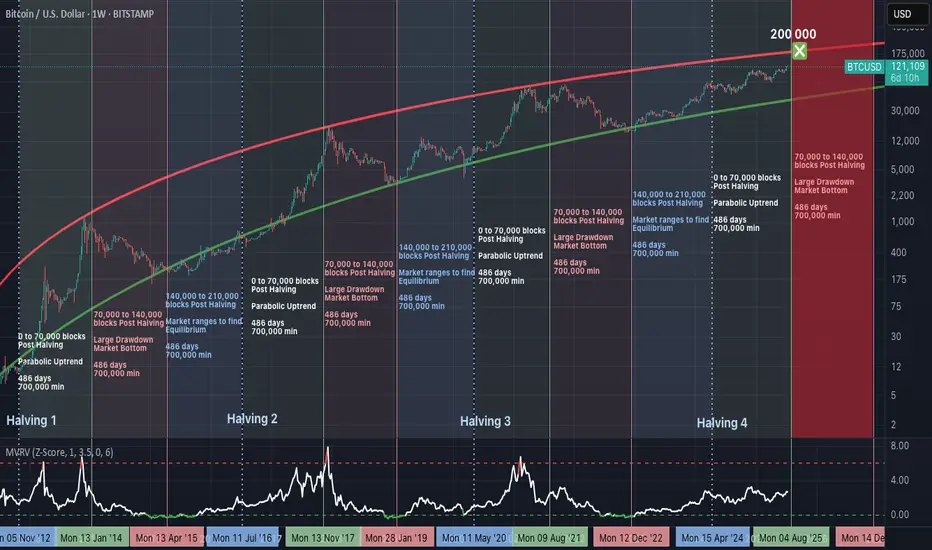
Bitcoin’s price consistently follows a 3-phase structure after each halving, with ~486 days per phase. If history repeats, we are nearing the end of the parabolic phase, with a potential peak around $200,000, before entering a structured drawdown.
Halving Cycles: The Real Clock Behind Bitcoin
Bitcoin’s monetary policy is pre-programmed.
A halving occurs approximately every 210,000 blocks (~4 years), and market behaviour after each halving follows this repeating pattern:
Each phase lasts approximately 486 days, and this structure has repeated reliably since 2012.
Phase 1: The Parabolic Rally (Current Phase)
We are currently in the growth segment of the cycle:
Roughly 700,000 BTC are mined during this period, creating a supply shock as issuance is halved while demand accelerates.
Phase 2: The Drawdown (Expected Next)
Historically begins between block 70,000 to 140,000 post-halving.
This phase resets the market and eliminates unsustainable excess.
Phase 3: The Equilibrium Phase
Occurs between block 140,000 to 210,000 post-halving.
This phase is critical in building the base for the next cycle.
MVRV Z-Score: Market Thermometer
The chart includes the MVRV Z-Score, a key metric showing how far price deviates from realized value:
Why $200,000 Is in Sight
The projected resistance curve on the chart suggests that:
This price level is not arbitrary—it is derived from the same structure that defined previous peaks.
What Comes After
If the historical cycle structure remains intact:
This is where conviction and preparation matter most.
Final Thoughts
Bitcoin cycles are not random. They are structured around block height, issuance, and miner economics.
Every cycle since 2012 has followed this 486-day framework, divided across parabola, crash, and reset. This model has outperformed calendar-based predictions and technical narratives.
Disclaimer
This content is for educational and informational purposes only and does not constitute financial, investment, or trading advice. Past performance is not indicative of future results. Always do your own research and consult with a qualified financial advisor before making investment decisions. The author holds no responsibility for any losses incurred as a result of using the information presented herein.
Bitcoin’s price consistently follows a 3-phase structure after each halving, with ~486 days per phase. If history repeats, we are nearing the end of the parabolic phase, with a potential peak around $200,000, before entering a structured drawdown.
Halving Cycles: The Real Clock Behind Bitcoin
Bitcoin’s monetary policy is pre-programmed.
A halving occurs approximately every 210,000 blocks (~4 years), and market behaviour after each halving follows this repeating pattern:
- Phase 1: Parabolic Rally (0 to 70,000 blocks post-halving).
- Phase 2: Major Drawdown (70,000 to 140,000 blocks).
- Phase 3: Equilibrium Phase (140,000 to 210,000 blocks).
Each phase lasts approximately 486 days, and this structure has repeated reliably since 2012.
Phase 1: The Parabolic Rally (Current Phase)
We are currently in the growth segment of the cycle:
- Price rising rapidly.
- Miner profitability at highs.
- Hashrate and network security increasing.
- MVRV Z-Score steadily climbing, but not yet overextended.
Roughly 700,000 BTC are mined during this period, creating a supply shock as issuance is halved while demand accelerates.
Phase 2: The Drawdown (Expected Next)
Historically begins between block 70,000 to 140,000 post-halving.
- Market peaks and begins to correct.
- Miner margins compress.
- Hashrate may plateau or decline.
- Forced selling and miner capitulation drive volatility.
- Price retraces significantly from the peak.
This phase resets the market and eliminates unsustainable excess.
Phase 3: The Equilibrium Phase
Occurs between block 140,000 to 210,000 post-halving.
- Price enters consolidation.
- Realized value and market price converge.
- Ideal accumulation period for long-term investors.
- Network fundamentals stabilize ahead of the next halving.
This phase is critical in building the base for the next cycle.
MVRV Z-Score: Market Thermometer
The chart includes the MVRV Z-Score, a key metric showing how far price deviates from realized value:
- Readings above 6.0 have consistently marked cycle tops.
- Readings near or below 0 have marked major bottoms.
- Current value is around 2.67 — indicating a rising trend, but not overheated.
- This metric reflects market-wide profitability and speculative pressure.
Why $200,000 Is in Sight
The projected resistance curve on the chart suggests that:
- $200,000 aligns with the top of the long-term parabolic channel.
- It corresponds with the expected end of the parabolic phase (Q1–Q2 2026).
- It fits prior extension patterns following each halving.
- It is a strong psychological target, likely to trigger heavy profit-taking.
This price level is not arbitrary—it is derived from the same structure that defined previous peaks.
What Comes After
If the historical cycle structure remains intact:
- The peak should occur before mid-2026.
- A deep correction phase follows, likely into 2027.
- True bottoms tend to occur as miner capitulation concludes and difficulty adjusts downward.
This is where conviction and preparation matter most.
Final Thoughts
Bitcoin cycles are not random. They are structured around block height, issuance, and miner economics.
Every cycle since 2012 has followed this 486-day framework, divided across parabola, crash, and reset. This model has outperformed calendar-based predictions and technical narratives.
Disclaimer
This content is for educational and informational purposes only and does not constitute financial, investment, or trading advice. Past performance is not indicative of future results. Always do your own research and consult with a qualified financial advisor before making investment decisions. The author holds no responsibility for any losses incurred as a result of using the information presented herein.
Related publications
Disclaimer
The information and publications are not meant to be, and do not constitute, financial, investment, trading, or other types of advice or recommendations supplied or endorsed by TradingView. Read more in the Terms of Use.
Related publications
Disclaimer
The information and publications are not meant to be, and do not constitute, financial, investment, trading, or other types of advice or recommendations supplied or endorsed by TradingView. Read more in the Terms of Use.