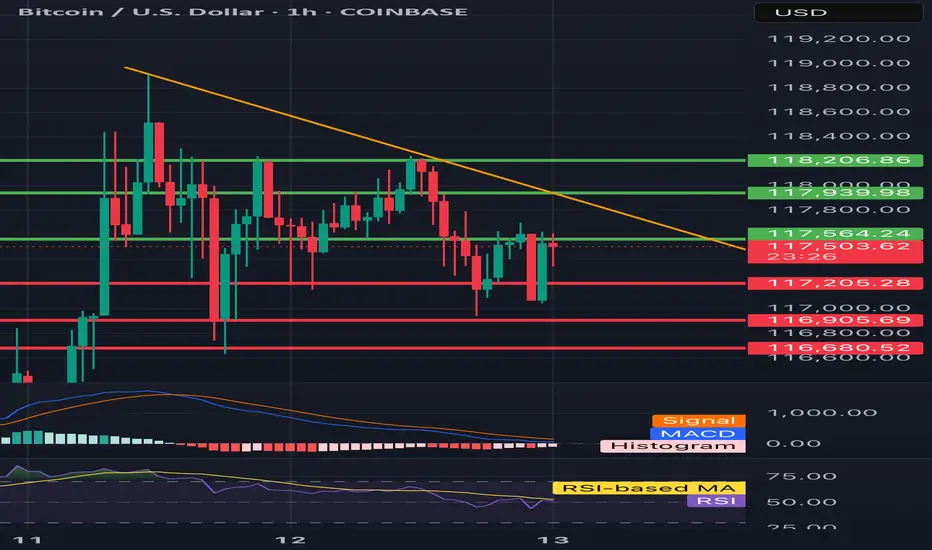
🔻 Trend:
• Currently visible inheritance channel - confirmed by the yellow inheritance trend (decreasing peaks).
• The price tests resistance in the area 117.564 - possible to break out, but requires confirmation of the volume.
⸻
📊 levels of support and resistance:
• resistance:
• 117,564 (here we are now - resistance test)
• 117,939
• 118,206 (key level - potential breaking from the channel)
• Support:
• 117,205 - a recent hole, valid short -term
• 116,905
• 116,680 - deeper support, possible target with further decline
⸻
📉 Macd:
• The histogram begins to decrease, but the MacD line and the signal line still below zero → still weakness.
• Possibility to build a base for reversing the trend, but there is no clear signal intersection.
⸻
📉 RSI (Relative Strength Index):
• RSI below 50, but it starts to reflect slightly.
• MA RSI is still falling → no strong growth dynamics.
⸻
🔍 Applications:
• The downward trend still dominates, but the price is trying to pierce local resistance (117.564).
• If it breaks above 117,939–118,206 and persists, a possible change in the direction at a short interval.
• If he rejects the resistance - a quick descend to 117.205 or lower (116,900-116,680).
⸻
⚠️ Signals for observation:
• Closing the candle 1h above 118.206 - Bullly Breakout.
• Rejection of level 117.564 and descent below 117,200 - confirmation of further decline.
• MacD and RSI - 50 - potential change of direction.
Disclaimer
The information and publications are not meant to be, and do not constitute, financial, investment, trading, or other types of advice or recommendations supplied or endorsed by TradingView. Read more in the Terms of Use.
Disclaimer
The information and publications are not meant to be, and do not constitute, financial, investment, trading, or other types of advice or recommendations supplied or endorsed by TradingView. Read more in the Terms of Use.