2015

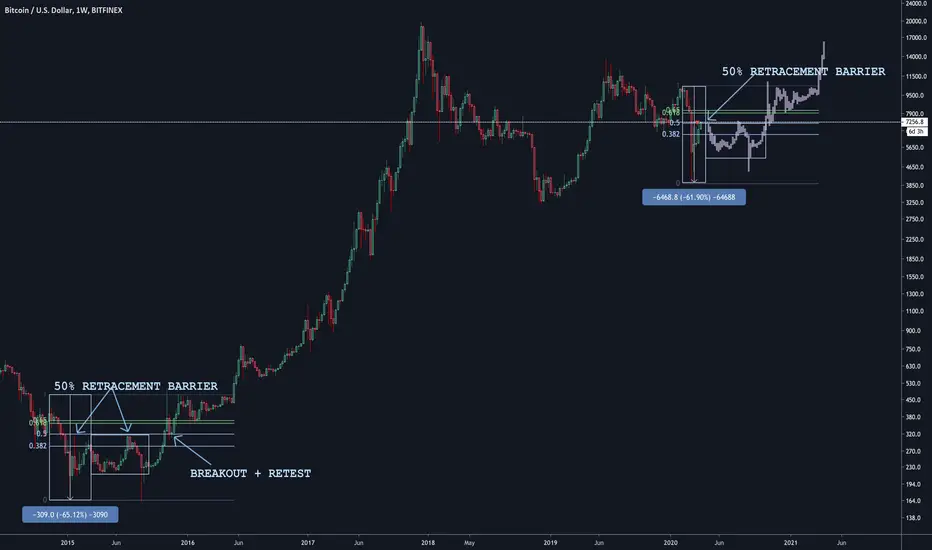
2020 vs 2015 Similarities

______________________________________________________________________________________________________
Summary of Both Charts:
VERDICT: Bitcoin to remain under $7400 and trade sideways for a few months, bouncing between $3800 and $7400
- 50% Fibonacci Level held as a pivot as price traded under it whilst testing it
- 50% Fibonacci was re-tested upon breakout
- Capitulation was -65%
- Capitulation wick was -22% below the close
- Price simply traded sideways within a range
2020 vs 2015 Similarities
- 50% Fibonacci Level being tested as of now and this is a key pivot zone
- Capitulation was -62% which is similar to -65% of 2015
- Capitulation wick was -26% below the close which is similar to -22% of 2015
______________________________________________________________________________________________________
Summary of Both Charts:
- Big Capitulation
- Initial Retracement
- Sideways Accumulation Between Low & Retracement Level
VERDICT: Bitcoin to remain under $7400 and trade sideways for a few months, bouncing between $3800 and $7400
Note
Disclaimer
The information and publications are not meant to be, and do not constitute, financial, investment, trading, or other types of advice or recommendations supplied or endorsed by TradingView. Read more in the Terms of Use.
Disclaimer
The information and publications are not meant to be, and do not constitute, financial, investment, trading, or other types of advice or recommendations supplied or endorsed by TradingView. Read more in the Terms of Use.