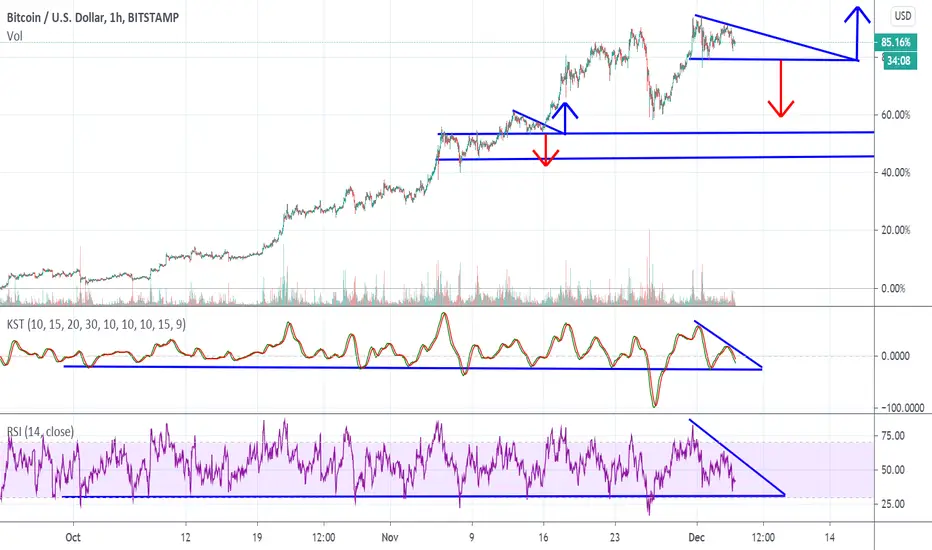
Or, potentially a descending triangle is forming, only time will tell.
On the KST there's been a bearish cross.
The RSI is displaying a potential descending triangle or bull flag similar to the price action.
On the KST there's been a bearish cross.
The RSI is displaying a potential descending triangle or bull flag similar to the price action.
Related publications
Disclaimer
The information and publications are not meant to be, and do not constitute, financial, investment, trading, or other types of advice or recommendations supplied or endorsed by TradingView. Read more in the Terms of Use.
Related publications
Disclaimer
The information and publications are not meant to be, and do not constitute, financial, investment, trading, or other types of advice or recommendations supplied or endorsed by TradingView. Read more in the Terms of Use.