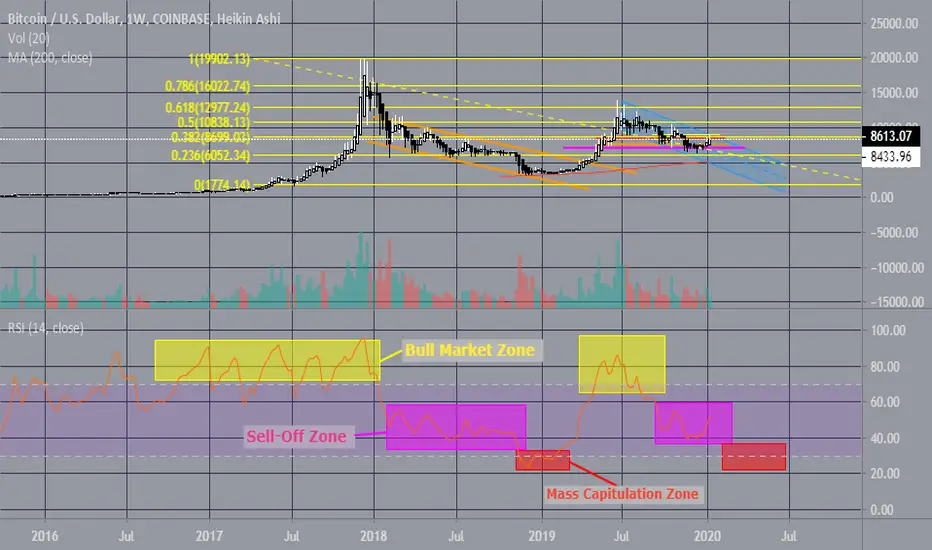
While looking at your weekly chart, we can find a pattern to work with. Our YELLOW zone is what i like to just call the "Bull Market Zone". While in the bull market zone we can easily see that RSI is constantly oversold and stay right above the fifty-eight (58) on the RSI. Next, we come to find our "Sell-Off Zone" which is the PURPLE area. This typically falls into fifty-eight (58) and all the way down to thirty-six (36). While in this stage, we begin to enter the confirmed bear market, which is right about when we pass down through the Two Hundred (200) MA. The last zone to highlight is the "Mass Capitulation Zone", which is the RED area. In this instance, we are selling off extremely hard, as hodlers are not ready to let their Bitcoin drop to such a low point. This area can be found with thirty-six (36) through twenty-one (21). In the mass capitulation zone... BUY!!!!
Disclaimer
The information and publications are not meant to be, and do not constitute, financial, investment, trading, or other types of advice or recommendations supplied or endorsed by TradingView. Read more in the Terms of Use.
Disclaimer
The information and publications are not meant to be, and do not constitute, financial, investment, trading, or other types of advice or recommendations supplied or endorsed by TradingView. Read more in the Terms of Use.