I believe that it is possible to beat the market through a consistent and unemotional approach. This is primarily achieved through preparing instead of reacting. Click here to get my complete trading strategy and click here to learn more about how I use the indicators below! Please be advised that I swing trade and will often hold onto a position for > 1 month. What you do with your $ is your business, what I do with my $ is my business.
1 day: Today is the day for a $6,000 retest. If not then tomorrow for sure! | 1 week: Breakdown $5,750 | 1 month predictions: < $5,000 by 9/5 | bottom prediction: $3,000 by 10/30
Previous analysis/position: Short sellers nearing all time high combined with expensive funding rates had me concerned. Closed 20% of my short positions and tightened stops due to strong resistance at $6,650 - $6,850 / Short ETH:USD | ETH:BTC
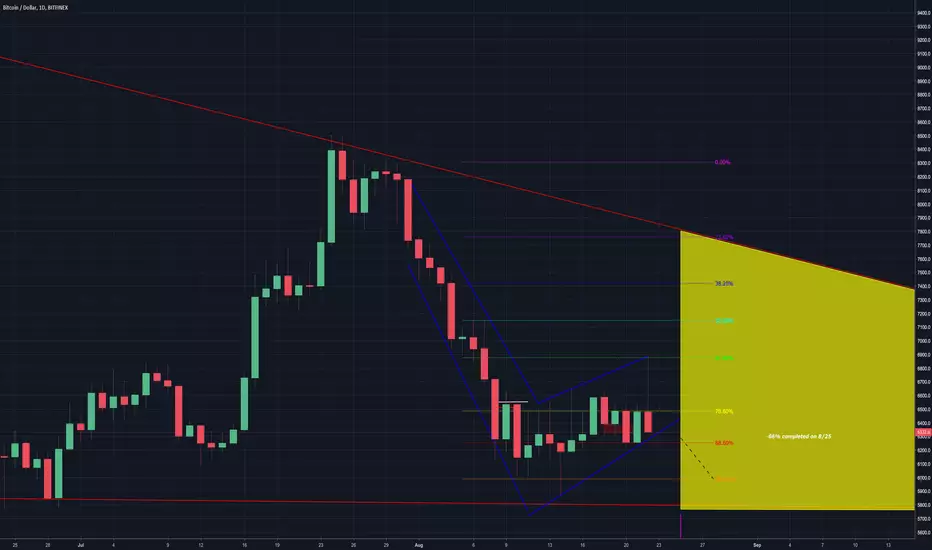
Patterns: Descending triangle & bear flag. Bounce was rejected at 0.618 fib which means bear flag is still in tact.
Horizontal support and resistance: R: $6,500 | S: $6,250
BTCUSDSHORTS: Could be double top. Could also find support and turn into c&h or Bulkowski Big W. Daily candle looks like it will engulf yesterday’s.
Funding Rates: longs pay shorts 0.01%
12 & 26 EMA’s (calculate % difference): 12 = -0.46% | 26 = -3.54%
50 & 128 MA’s: 50 = -7.33% (was resistance for last squeeze) | 128 = -13.83%
Volume: > daily MA. Watching for local high.
FIB’s: 0.618 = $6,895 | 0.886 = $6,280
Candlestick analysis: Nasty shooting star on the daily vs weekly hammer. Timeframe outweighs everything but trend, therefore I believe daily shooting star.
Ichimoku Cloud: Tenkan-Sen diverging from Kijun-Sen following the bearish TK’ Cross.
TD’ Sequential: R3 < R2
Visible Range: Point of control over last 6 months is $6,382
BTC’ Price Spreadsheet: 12h = -5.12% | 1d = -2.12% | 1w = +0.95% | 2w = -3.33% | -14.51%
Bollinger Bands: Almost tested the top band with that last squeeze. Didn’t take long to pullback below MA. Watch for that to hold as resistance at $6,500
Trendline: Bear flag
Daily Trend: Chop
Fractals: Briefly broke through two up fractals at $6,600 however does not look like we will close above those fractals. Down = $5,863
On Balance Volume: Bear div’ on daily.
ADX: ADX pulling back. +DI crossed above -DI and appears to be diverging.
Chaikin Money Flow: Still large bull div’ on weekly. However it has started to pull back. Will it create a higher low? Slight bear div’ in daily with lower low.
RSI (30 setting): D = 44.47 | W = 48.54
Stoch: Testing 20 on weekly after a second lower high. Surprised 3d hasn’t crossed 20 after last squeeze. Daily looks like it wan’t to make bearish cross after last one was a fakeout.
Summary: The daily candle is painting a very clear picture with it’s wick on top being > 2X the size of the body. The price quickly pulled back from the 0.618 FIB after the short squeeze that everyone was waiting for yesterday. Now the funding rates are back to equilibrium (0.01%) with longs paying shorts.
I am also keeping in mind the ETF announcement that is expected tomorrow. I think there is < 10% of approval due to a variety of reasons. If we get the bad news i expect while the chart shows such a bearish bias with the bull flag, descending triangle and shooting star then expect a massive sell off to follow.
Today is the day I would expect traders with inside information to be positioning themselves and that could be a reason we pulled back so hard from $6,875. If you are not currently positioned then I would consider opening a short before tomorrow morning. A high volume breakdown of the bear flag should provide a great entry. When selling a bear flag I like to enter 1/3 after the breakdown, 1/3 on the throwback and 1/3 on the breakdown of horizontal support. If no throwback then 2/3 on horizontal breakdown. This helps to minimize losses when the position turns against me and makes decision making less stressful when entering a large position.

1 day: Today is the day for a $6,000 retest. If not then tomorrow for sure! | 1 week: Breakdown $5,750 | 1 month predictions: < $5,000 by 9/5 | bottom prediction: $3,000 by 10/30
Previous analysis/position: Short sellers nearing all time high combined with expensive funding rates had me concerned. Closed 20% of my short positions and tightened stops due to strong resistance at $6,650 - $6,850 / Short ETH:USD | ETH:BTC
Patterns: Descending triangle & bear flag. Bounce was rejected at 0.618 fib which means bear flag is still in tact.
Horizontal support and resistance: R: $6,500 | S: $6,250
BTCUSDSHORTS: Could be double top. Could also find support and turn into c&h or Bulkowski Big W. Daily candle looks like it will engulf yesterday’s.
Funding Rates: longs pay shorts 0.01%
12 & 26 EMA’s (calculate % difference): 12 = -0.46% | 26 = -3.54%
50 & 128 MA’s: 50 = -7.33% (was resistance for last squeeze) | 128 = -13.83%
Volume: > daily MA. Watching for local high.
FIB’s: 0.618 = $6,895 | 0.886 = $6,280
Candlestick analysis: Nasty shooting star on the daily vs weekly hammer. Timeframe outweighs everything but trend, therefore I believe daily shooting star.
Ichimoku Cloud: Tenkan-Sen diverging from Kijun-Sen following the bearish TK’ Cross.
TD’ Sequential: R3 < R2
Visible Range: Point of control over last 6 months is $6,382
BTC’ Price Spreadsheet: 12h = -5.12% | 1d = -2.12% | 1w = +0.95% | 2w = -3.33% | -14.51%
Bollinger Bands: Almost tested the top band with that last squeeze. Didn’t take long to pullback below MA. Watch for that to hold as resistance at $6,500
Trendline: Bear flag
Daily Trend: Chop
Fractals: Briefly broke through two up fractals at $6,600 however does not look like we will close above those fractals. Down = $5,863
On Balance Volume: Bear div’ on daily.
ADX: ADX pulling back. +DI crossed above -DI and appears to be diverging.
Chaikin Money Flow: Still large bull div’ on weekly. However it has started to pull back. Will it create a higher low? Slight bear div’ in daily with lower low.
RSI (30 setting): D = 44.47 | W = 48.54
Stoch: Testing 20 on weekly after a second lower high. Surprised 3d hasn’t crossed 20 after last squeeze. Daily looks like it wan’t to make bearish cross after last one was a fakeout.
Summary: The daily candle is painting a very clear picture with it’s wick on top being > 2X the size of the body. The price quickly pulled back from the 0.618 FIB after the short squeeze that everyone was waiting for yesterday. Now the funding rates are back to equilibrium (0.01%) with longs paying shorts.
I am also keeping in mind the ETF announcement that is expected tomorrow. I think there is < 10% of approval due to a variety of reasons. If we get the bad news i expect while the chart shows such a bearish bias with the bull flag, descending triangle and shooting star then expect a massive sell off to follow.
Today is the day I would expect traders with inside information to be positioning themselves and that could be a reason we pulled back so hard from $6,875. If you are not currently positioned then I would consider opening a short before tomorrow morning. A high volume breakdown of the bear flag should provide a great entry. When selling a bear flag I like to enter 1/3 after the breakdown, 1/3 on the throwback and 1/3 on the breakdown of horizontal support. If no throwback then 2/3 on horizontal breakdown. This helps to minimize losses when the position turns against me and makes decision making less stressful when entering a large position.
emasar Indicator is available for purchase at alphanalysis.io/product/emasar/
Disclaimer
The information and publications are not meant to be, and do not constitute, financial, investment, trading, or other types of advice or recommendations supplied or endorsed by TradingView. Read more in the Terms of Use.