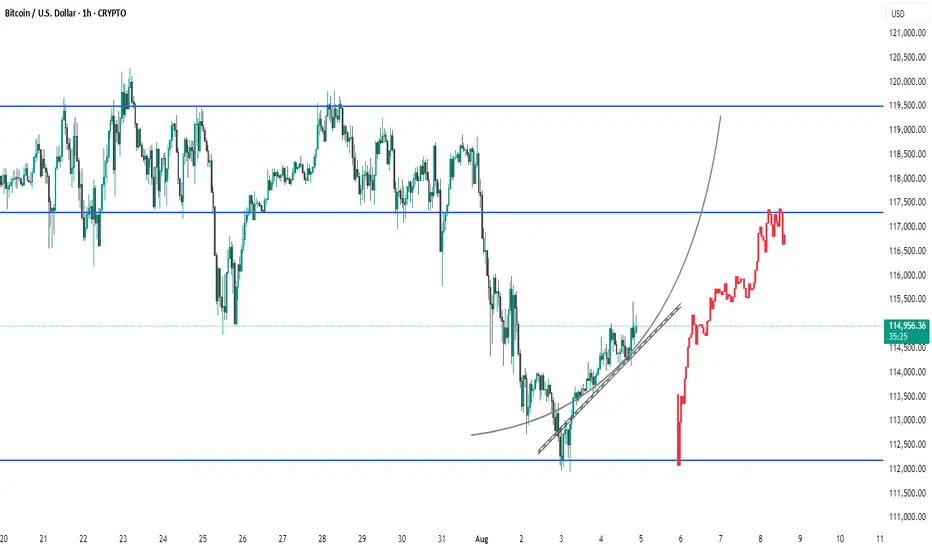
This 1-hour Bitcoin (BTC/USD) chart shows a clear recovery from recent lows, breaking through a resistance zone around $115,000. The projected red path suggests a bullish continuation toward the $117,000–$119,000 area, supported by a parabolic curve and upward trendlines. However, the price is currently facing resistance near $117,000, as indicated by the minor rejection at the top. Key support lies near $112,000 if the bullish scenario fails.
Disclaimer
The information and publications are not meant to be, and do not constitute, financial, investment, trading, or other types of advice or recommendations supplied or endorsed by TradingView. Read more in the Terms of Use.
Disclaimer
The information and publications are not meant to be, and do not constitute, financial, investment, trading, or other types of advice or recommendations supplied or endorsed by TradingView. Read more in the Terms of Use.