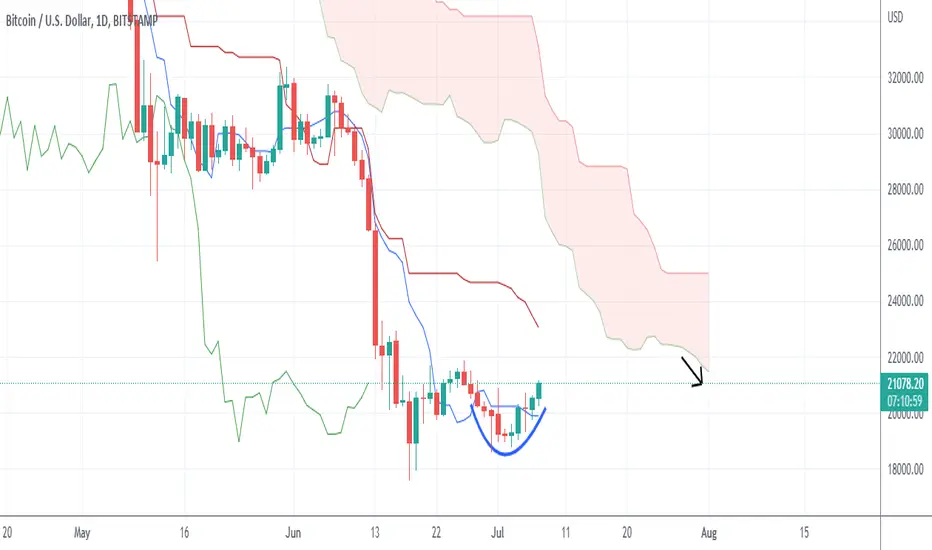
BTC looks like there is a retrace that can reach the price of 22,800 if you look at the existing pattern.
On the D1 chart the candle forms a bullish momentum, but all the ichimoku parameters still indicate that the selling pressure is still strong. This retrace is not the start of a bullish trend in my opinion, this is only a retrace with a simple a-b-c pattern, most likely.
The kumo cloud still indicates selling pressure, with quite thick volume. Don't be fooled into making a purchase. Well you wait. I'm more focused on determining when it's time for me to enter to short
Disclaimer
The information and publications are not meant to be, and do not constitute, financial, investment, trading, or other types of advice or recommendations supplied or endorsed by TradingView. Read more in the Terms of Use.
Disclaimer
The information and publications are not meant to be, and do not constitute, financial, investment, trading, or other types of advice or recommendations supplied or endorsed by TradingView. Read more in the Terms of Use.