⊣
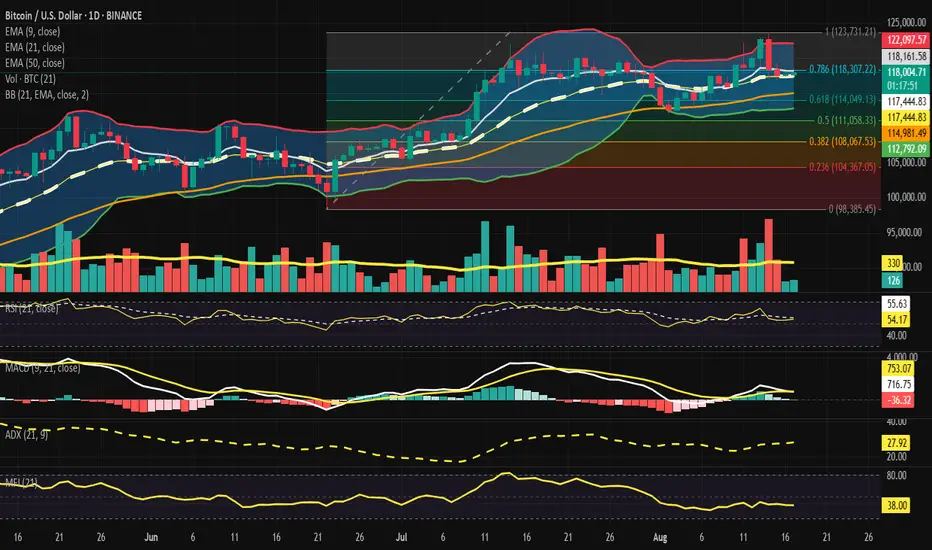
⟁ BTC/USD - BINANCE - (CHART: 1D) - (Aug 17, 2025).
◇ Analysis Price: $117,902.79.
⊣
⨀ I. Temporal Axis - Strategic Interval - (1D):
▦ EMA9 - $118,141.19:
∴ Current price sits $238.40 (−0.20%) below the EMA9, signaling short-term momentum cooling;
∴ The EMA9 is still aligned above EMA21 and EMA50, reflecting bullish micro-trend structure;
∴ However, the rejection from EMA9 suggests it is acting as immediate resistance rather than support.
✴️ Conclusion: The EMA9 transforms into a barrier for continuation; price must reclaim it promptly or risk sliding deeper into mid-range.
⊢
▦ EMA21 - $117,435.56:
∴ Spot trades $467.23 (+0.40%) above EMA21;
∴ EMA21 coincides with the Bollinger Basis, reinforcing its importance as the primary daily mean;
∴ The EMA21 serves as a pivot magnet - losing it would turn the short/mid bias neutral.
✴️ Conclusion: EMA21 remains structural support anchoring the trend, but pressure is visible from overhead EMA9.
⊢
▦ EMA50 - $114,977.49:
∴ Spot trades $2,925.30 (+2.55%) above EMA50;
∴ The bullish stack (EMA9 -> EMA21 -> EMA50) holds intact, confirming trend integrity on the mid horizon;
∴ A drop to EMA50 would mark a full corrective retracement, aligning with (Fibo 0.618 - $114,049.13).
✴️ Conclusion: EMA50 is the deeper structural defense; maintaining distance here preserves the bullish medium trend.
⊢
▦ BB (21, 2) - Basis: $117,435.56 / Upper: $122,084.15 / Lower: $112,786.98:
∴ Bandwidth (≈ 7.9%) of the basis -> market in a moderate volatility state;
∴ %B (≈ 0.54), situating price in the upper-mid envelope, not yet expansionary;
∴ Distance to upper band = (+3.54%), to lower band = (−4.34%), giving slightly more downside breathing room.
✴️ Conclusion: Market is balanced in volatility containment, with room both ways, yet downside slightly more open than upside.
⊢
▦ Volume (21) - 330 (current bar: 124):
∴ Current volume = (62.4%) below the rolling average -> weak participation;
∴ Weak volume on corrective candles indicates seller conviction lacking;
∴ Lack of strong volume also impairs breakout potential, keeping consolidation dominant.
✴️ Conclusion: Thin liquidity magnifies potential for wicks and mean reversions, reducing clarity of current move.
⊢
▦ RSI (21, 9) - RSI: 54.00 | Signal: 55.60:
∴ RSI resides in the neutral-positive range, above the 50-line;
∴ Momentum lags the EMA9 signal -> short-term bearish divergence;
∴ No oversold/overbought conditions (20–80 boundaries untouched).
✴️ Conclusion: RSI reflects fragile bullishness, vulnerable to further drift unless it recaptures momentum above signal.
⊢
▦ MACD (9, 21, 9) - Line: 705.63 / Signal: 750.84 / Histogram: –45.21:
∴ MACD line under signal confirms bearish crossover;
∴ Histogram remains negative yet shallow, consistent with corrective phase, not collapse;
∴ Momentum is softening, aligning with RSI’s neutral drift.
✴️ Conclusion: MACD indicates waning momentum but not trend failure - a corrective digestion phase is unfolding.
⊢
▦ ADX (21, 9) - 27.92:
∴ ADX -> 25 shows a moderate active trend;
∴ No extreme strength (>40), leaving market prone to external catalysts (macro/news);
∴ Combined with EMA stack, direction leans bullish, but ADX’s plateau signals loss of directional energy.
✴️ Conclusion: ADX affirms trend strength but hints that fuel is draining, requiring new impulse for extension.
⊢
▦ MFI (21) - 37.98:
∴ Sub-50 reflects capital outflows dominating inflows;
∴ Value remains far from oversold (<20), no exhaustion yet;
∴ Divergence emerges if price holds above EMA21 while liquidity bleeds.
✴️ Conclusion: Liquidity suggests buyers hesitating, weakening upside conviction.
⊢
▦ Fibonacci Retracement (0.000 / 1.000) - Low: $98,385.45 -> High: $123,731.21:
∴ 0.786 ($118,307.22) - Current price sits $404.43 (−0.34%) below, forming short-term ceiling;
∴ 0.618 ($114,049.13) - Key support, confluent with EMA50 ($114,977.49);
∴ 0.500 ($111,058.33) - Deeper retracement support, aligning with volatility lower structure.
✴️ Conclusion: Market trapped between 0.786 resistance and 0.618/EMA50 support -> pivotal compression zone.
⊢
🜎 Strategic Insight - Technical Oracle:
∴ The BTC/USD daily structure reveals a market in compression: EMA9 as immediate resistance, EMA21 as fragile pivot, and EMA50 + Fib 0.618 as deep anchor support;
∴ RSI and MACD both highlight momentum decay, while ADX confirms moderate but fading trend strength;
∴ MFI points to hesitant inflows, warning of liquidity weakness;
∴ Thus, the battlefield crystallizes: $118,307.22 (Fib 0.786 / EMA9 proximity) as resistance, and $114,049–114,977 (Fib 0.618 + EMA50) as structural defense. A break either way will dictate expansion.
✴️ Conclusion: Until resolved, the market remains in stoic compression - silence before expansion.
⊢
∫ III. On-Chain Intelligence - (Source: CryptoQuant):
▦ Exchange Inflow Total + EMA9 - (All Exchanges):
∴ Historically, surges in inflows correlate with distribution events - localized tops or sell pressure phases;
∴ The current inflow reading remains muted, far below major spikes (100K / 300K BTC) observed during prior capitulation or distribution clusters;
∴ Sustained low inflows indicate reduced immediate sell pressure, aligning with exchange reserves declining trend.
✴️ Conclusion: Current inflow profile is neutral-to-bullish, as supply entering exchanges is contained.
⊢
▦ Structural Pattern (2022 -> 2025):
∴ In 2022–2023, inflows frequently exceeded 200K BTC, triggering strong bearish legs;
∴ Since 2024, inflow peaks are smaller and less frequent, even as price advanced past $100K - showing increased holding conviction;
∴ Localized inflow upticks in early 2025 preceded short-term corrections, yet were absorbed without trend breakdown.
✴️ Conclusion: Market maturity visible - holders distribute less aggressively, supporting resilience of higher valuations.
⊢
▦ EMA9 Overlay (On-Chain Inflow Smoothing) - (not numerically explicit, observed visually):
∴ EMA9 of inflows remains flat-to-declining into mid-2025;
∴ Lack of sustained inflow uptrend -> exchanges not receiving systematic sell-side waves;
∴ This reduction aligns with macro hodling behavior dominating.
✴️ Conclusion: The inflow EMA reinforces quiet supply pressure, consistent with accumulation psychology.
⊢
🜎 Strategic Insight - On-Chain Oracle:
∴ Exchange inflow dynamics confirm a structurally quieter supply environment compared to previous cycles;
∴ While localized inflow bursts still produce short-term pullbacks, the overarching pattern is one of diminished distribution;
∴ In tandem with technical compression (Fib 0.786 vs 0.618 battle on daily chart), this on-chain restraint tilts risk asymmetry toward buyers - provided inflows remain subdued.
✴️ Conclusion: The silence of supply is itself a force: fewer coins offered into the market mean any liquidity shock could amplify upward expansion.
⊢
⟁ BTC/USD - CME Futures BTC1! - (CHART: 1D) - (Aug 17, 2025):
◇ Current Price: $118.150.
◇ Chart Link:
⊣
▦ CME Futures GAP - Observation & Ritual Closure:
∴ GAP CME (Open vs. Previous Close) = +760 pts (+0.65%);
∴ This leaves an upward GAP from ($117,235) -> ($117,995);
∴ GAP already in partial closure zone (low today $117,645).
✴️ Conclusion: CME opened with bullish GAP, partially tested intraday. Historical tendencies favor full gap closure within subsequent sessions (≈ 85% probability), yet persistence above $118K could normalize it as a continuation gap.
⊢
▦ Volume (CME - Session) - 38 contracts (low relative participation):
∴ Initial session prints show light activity;
∴ Weak volume reduces conviction of gap as an institutional “breakaway”;
∴ Implies gap more likely to be filled than sustained immediately.
✴️ Conclusion: Low conviction inflow reduces sustainability of gap.
⊢
🜎 Strategic Insight - CME Oracle:
∴ The CME chart reveals an upward opening GAP (+760 pts), currently under test. Historically, such gaps on BTC futures act as magnets until closure, unless validated by institutional surge volume;
∴ With today’s session showing thin activity, the odds tilt toward eventual closure at ($117,235);
∴ Thus, the institutional map places immediate magnetic risk below spot, even as the daily technicals (BTC/USD - 1D) compress between (Fib 0.786 and EMA50).
⧉ Together with subdued on-chain inflows, the structure suggests:
⊢
𓂀 Stoic-Structural Interpretation:
∴ The daily BTC/USD frame manifests in compression - EMA9 overhead resistance vs. EMA21/EMA50 layered supports, with Fib 0.786 as ceiling and 0.618 as anchor;
∴ On-chain inflows remain muted, signaling reduced distribution and a silent, stoic restraint of supply;
∴ The CME Futures GAP (+760 pts) exerts a gravitational magnet toward ($117,235), yet its low-volume print weakens institutional conviction.
✴️ Stoic Arcane Conclusion: Structure stands at the threshold of stoic tension - supply muted, momentum fading, futures pulling. The silence of inflows aligns with a potential expansion, yet institutional gravity demands respect.
⊢
✦ Structure:
∴ BTC/USD (1D Spot) -> Compression defined between Fib 0.786 ($118,307) resistance and Fib 0.618 + EMA50 ($114,049–114,977) support; EMA9 acts as immediate friction, EMA21 as fragile pivot;
∴ On-Chain Inflows -> Exchange inflows remain muted (10.2K BTC recent), far from historic distribution surges, confirming supply silence and stronger holder conviction;
∴ CME Futures -> Market opened with an upward GAP (+760 pts) from $117,235–$117,995, partially tested but unresolved; low volume weakens breakout sustainability, implying magnetic pull back toward closure.
✴️ Structural Reading: Bitcoin stands at a convergent triad - technical compression, on-chain restraint, and institutional gap gravity. Expansion is imminent, but direction hinges on whether the spot chart breaks above ($118,307) or the CME magnet drags price to ($117,235).
⊢
· Cryptorvm Dominvs · MAGISTER ARCANVM · Vox Primordialis ·
· Dominivm Cardo Gyratio Omnivm · Silence precedes the next force. Structure is sacred ·
⊢
⟁ BTC/USD - BINANCE - (CHART: 1D) - (Aug 17, 2025).
◇ Analysis Price: $117,902.79.
⊣
⨀ I. Temporal Axis - Strategic Interval - (1D):
▦ EMA9 - $118,141.19:
∴ Current price sits $238.40 (−0.20%) below the EMA9, signaling short-term momentum cooling;
∴ The EMA9 is still aligned above EMA21 and EMA50, reflecting bullish micro-trend structure;
∴ However, the rejection from EMA9 suggests it is acting as immediate resistance rather than support.
✴️ Conclusion: The EMA9 transforms into a barrier for continuation; price must reclaim it promptly or risk sliding deeper into mid-range.
⊢
▦ EMA21 - $117,435.56:
∴ Spot trades $467.23 (+0.40%) above EMA21;
∴ EMA21 coincides with the Bollinger Basis, reinforcing its importance as the primary daily mean;
∴ The EMA21 serves as a pivot magnet - losing it would turn the short/mid bias neutral.
✴️ Conclusion: EMA21 remains structural support anchoring the trend, but pressure is visible from overhead EMA9.
⊢
▦ EMA50 - $114,977.49:
∴ Spot trades $2,925.30 (+2.55%) above EMA50;
∴ The bullish stack (EMA9 -> EMA21 -> EMA50) holds intact, confirming trend integrity on the mid horizon;
∴ A drop to EMA50 would mark a full corrective retracement, aligning with (Fibo 0.618 - $114,049.13).
✴️ Conclusion: EMA50 is the deeper structural defense; maintaining distance here preserves the bullish medium trend.
⊢
▦ BB (21, 2) - Basis: $117,435.56 / Upper: $122,084.15 / Lower: $112,786.98:
∴ Bandwidth (≈ 7.9%) of the basis -> market in a moderate volatility state;
∴ %B (≈ 0.54), situating price in the upper-mid envelope, not yet expansionary;
∴ Distance to upper band = (+3.54%), to lower band = (−4.34%), giving slightly more downside breathing room.
✴️ Conclusion: Market is balanced in volatility containment, with room both ways, yet downside slightly more open than upside.
⊢
▦ Volume (21) - 330 (current bar: 124):
∴ Current volume = (62.4%) below the rolling average -> weak participation;
∴ Weak volume on corrective candles indicates seller conviction lacking;
∴ Lack of strong volume also impairs breakout potential, keeping consolidation dominant.
✴️ Conclusion: Thin liquidity magnifies potential for wicks and mean reversions, reducing clarity of current move.
⊢
▦ RSI (21, 9) - RSI: 54.00 | Signal: 55.60:
∴ RSI resides in the neutral-positive range, above the 50-line;
∴ Momentum lags the EMA9 signal -> short-term bearish divergence;
∴ No oversold/overbought conditions (20–80 boundaries untouched).
✴️ Conclusion: RSI reflects fragile bullishness, vulnerable to further drift unless it recaptures momentum above signal.
⊢
▦ MACD (9, 21, 9) - Line: 705.63 / Signal: 750.84 / Histogram: –45.21:
∴ MACD line under signal confirms bearish crossover;
∴ Histogram remains negative yet shallow, consistent with corrective phase, not collapse;
∴ Momentum is softening, aligning with RSI’s neutral drift.
✴️ Conclusion: MACD indicates waning momentum but not trend failure - a corrective digestion phase is unfolding.
⊢
▦ ADX (21, 9) - 27.92:
∴ ADX -> 25 shows a moderate active trend;
∴ No extreme strength (>40), leaving market prone to external catalysts (macro/news);
∴ Combined with EMA stack, direction leans bullish, but ADX’s plateau signals loss of directional energy.
✴️ Conclusion: ADX affirms trend strength but hints that fuel is draining, requiring new impulse for extension.
⊢
▦ MFI (21) - 37.98:
∴ Sub-50 reflects capital outflows dominating inflows;
∴ Value remains far from oversold (<20), no exhaustion yet;
∴ Divergence emerges if price holds above EMA21 while liquidity bleeds.
✴️ Conclusion: Liquidity suggests buyers hesitating, weakening upside conviction.
⊢
▦ Fibonacci Retracement (0.000 / 1.000) - Low: $98,385.45 -> High: $123,731.21:
∴ 0.786 ($118,307.22) - Current price sits $404.43 (−0.34%) below, forming short-term ceiling;
∴ 0.618 ($114,049.13) - Key support, confluent with EMA50 ($114,977.49);
∴ 0.500 ($111,058.33) - Deeper retracement support, aligning with volatility lower structure.
✴️ Conclusion: Market trapped between 0.786 resistance and 0.618/EMA50 support -> pivotal compression zone.
⊢
🜎 Strategic Insight - Technical Oracle:
∴ The BTC/USD daily structure reveals a market in compression: EMA9 as immediate resistance, EMA21 as fragile pivot, and EMA50 + Fib 0.618 as deep anchor support;
∴ RSI and MACD both highlight momentum decay, while ADX confirms moderate but fading trend strength;
∴ MFI points to hesitant inflows, warning of liquidity weakness;
∴ Thus, the battlefield crystallizes: $118,307.22 (Fib 0.786 / EMA9 proximity) as resistance, and $114,049–114,977 (Fib 0.618 + EMA50) as structural defense. A break either way will dictate expansion.
✴️ Conclusion: Until resolved, the market remains in stoic compression - silence before expansion.
⊢
∫ III. On-Chain Intelligence - (Source: CryptoQuant):
▦ Exchange Inflow Total + EMA9 - (All Exchanges):
∴ Historically, surges in inflows correlate with distribution events - localized tops or sell pressure phases;
∴ The current inflow reading remains muted, far below major spikes (100K / 300K BTC) observed during prior capitulation or distribution clusters;
∴ Sustained low inflows indicate reduced immediate sell pressure, aligning with exchange reserves declining trend.
✴️ Conclusion: Current inflow profile is neutral-to-bullish, as supply entering exchanges is contained.
⊢
▦ Structural Pattern (2022 -> 2025):
∴ In 2022–2023, inflows frequently exceeded 200K BTC, triggering strong bearish legs;
∴ Since 2024, inflow peaks are smaller and less frequent, even as price advanced past $100K - showing increased holding conviction;
∴ Localized inflow upticks in early 2025 preceded short-term corrections, yet were absorbed without trend breakdown.
✴️ Conclusion: Market maturity visible - holders distribute less aggressively, supporting resilience of higher valuations.
⊢
▦ EMA9 Overlay (On-Chain Inflow Smoothing) - (not numerically explicit, observed visually):
∴ EMA9 of inflows remains flat-to-declining into mid-2025;
∴ Lack of sustained inflow uptrend -> exchanges not receiving systematic sell-side waves;
∴ This reduction aligns with macro hodling behavior dominating.
✴️ Conclusion: The inflow EMA reinforces quiet supply pressure, consistent with accumulation psychology.
⊢
🜎 Strategic Insight - On-Chain Oracle:
∴ Exchange inflow dynamics confirm a structurally quieter supply environment compared to previous cycles;
∴ While localized inflow bursts still produce short-term pullbacks, the overarching pattern is one of diminished distribution;
∴ In tandem with technical compression (Fib 0.786 vs 0.618 battle on daily chart), this on-chain restraint tilts risk asymmetry toward buyers - provided inflows remain subdued.
✴️ Conclusion: The silence of supply is itself a force: fewer coins offered into the market mean any liquidity shock could amplify upward expansion.
⊢
⟁ BTC/USD - CME Futures BTC1! - (CHART: 1D) - (Aug 17, 2025):
◇ Current Price: $118.150.
◇ Chart Link:
⊣
▦ CME Futures GAP - Observation & Ritual Closure:
- CME Previous Close - $117,235.00;
- CME Current Open - $117,995.00;
- CME Last Print - $118,150.00.
∴ GAP CME (Open vs. Previous Close) = +760 pts (+0.65%);
∴ This leaves an upward GAP from ($117,235) -> ($117,995);
∴ GAP already in partial closure zone (low today $117,645).
✴️ Conclusion: CME opened with bullish GAP, partially tested intraday. Historical tendencies favor full gap closure within subsequent sessions (≈ 85% probability), yet persistence above $118K could normalize it as a continuation gap.
⊢
▦ Volume (CME - Session) - 38 contracts (low relative participation):
∴ Initial session prints show light activity;
∴ Weak volume reduces conviction of gap as an institutional “breakaway”;
∴ Implies gap more likely to be filled than sustained immediately.
✴️ Conclusion: Low conviction inflow reduces sustainability of gap.
⊢
🜎 Strategic Insight - CME Oracle:
∴ The CME chart reveals an upward opening GAP (+760 pts), currently under test. Historically, such gaps on BTC futures act as magnets until closure, unless validated by institutional surge volume;
∴ With today’s session showing thin activity, the odds tilt toward eventual closure at ($117,235);
∴ Thus, the institutional map places immediate magnetic risk below spot, even as the daily technicals (BTC/USD - 1D) compress between (Fib 0.786 and EMA50).
⧉ Together with subdued on-chain inflows, the structure suggests:
- Spot chart = technical compression (awaiting breakout);
- On-chain = low supply inflows, bullish undertone;
- CME = gap pull magnet down toward ($117,235), unless denied by volume expansion.
⊢
𓂀 Stoic-Structural Interpretation:
∴ The daily BTC/USD frame manifests in compression - EMA9 overhead resistance vs. EMA21/EMA50 layered supports, with Fib 0.786 as ceiling and 0.618 as anchor;
∴ On-chain inflows remain muted, signaling reduced distribution and a silent, stoic restraint of supply;
∴ The CME Futures GAP (+760 pts) exerts a gravitational magnet toward ($117,235), yet its low-volume print weakens institutional conviction.
✴️ Stoic Arcane Conclusion: Structure stands at the threshold of stoic tension - supply muted, momentum fading, futures pulling. The silence of inflows aligns with a potential expansion, yet institutional gravity demands respect.
⊢
✦ Structure:
∴ BTC/USD (1D Spot) -> Compression defined between Fib 0.786 ($118,307) resistance and Fib 0.618 + EMA50 ($114,049–114,977) support; EMA9 acts as immediate friction, EMA21 as fragile pivot;
∴ On-Chain Inflows -> Exchange inflows remain muted (10.2K BTC recent), far from historic distribution surges, confirming supply silence and stronger holder conviction;
∴ CME Futures -> Market opened with an upward GAP (+760 pts) from $117,235–$117,995, partially tested but unresolved; low volume weakens breakout sustainability, implying magnetic pull back toward closure.
✴️ Structural Reading: Bitcoin stands at a convergent triad - technical compression, on-chain restraint, and institutional gap gravity. Expansion is imminent, but direction hinges on whether the spot chart breaks above ($118,307) or the CME magnet drags price to ($117,235).
⊢
· Cryptorvm Dominvs · MAGISTER ARCANVM · Vox Primordialis ·
· Dominivm Cardo Gyratio Omnivm · Silence precedes the next force. Structure is sacred ·
⊢
✠
Ritvs Logicæ in Terræ Chaos;
Nihil Tumultvs. Nihil Vanitatis. Tantum Silentivm, Structvra et Exsecutio.
𓂀 Vbi Volatilitas Disciplinam Tangit - Ibi Sto.
⩘ Porta Solum Aperitur Stantibvs in Silentio.
✠
Ritvs Logicæ in Terræ Chaos;
Nihil Tumultvs. Nihil Vanitatis. Tantum Silentivm, Structvra et Exsecutio.
𓂀 Vbi Volatilitas Disciplinam Tangit - Ibi Sto.
⩘ Porta Solum Aperitur Stantibvs in Silentio.
✠
Related publications
Disclaimer
The information and publications are not meant to be, and do not constitute, financial, investment, trading, or other types of advice or recommendations supplied or endorsed by TradingView. Read more in the Terms of Use.
✠
Ritvs Logicæ in Terræ Chaos;
Nihil Tumultvs. Nihil Vanitatis. Tantum Silentivm, Structvra et Exsecutio.
𓂀 Vbi Volatilitas Disciplinam Tangit - Ibi Sto.
⩘ Porta Solum Aperitur Stantibvs in Silentio.
✠
Ritvs Logicæ in Terræ Chaos;
Nihil Tumultvs. Nihil Vanitatis. Tantum Silentivm, Structvra et Exsecutio.
𓂀 Vbi Volatilitas Disciplinam Tangit - Ibi Sto.
⩘ Porta Solum Aperitur Stantibvs in Silentio.
✠
Related publications
Disclaimer
The information and publications are not meant to be, and do not constitute, financial, investment, trading, or other types of advice or recommendations supplied or endorsed by TradingView. Read more in the Terms of Use.