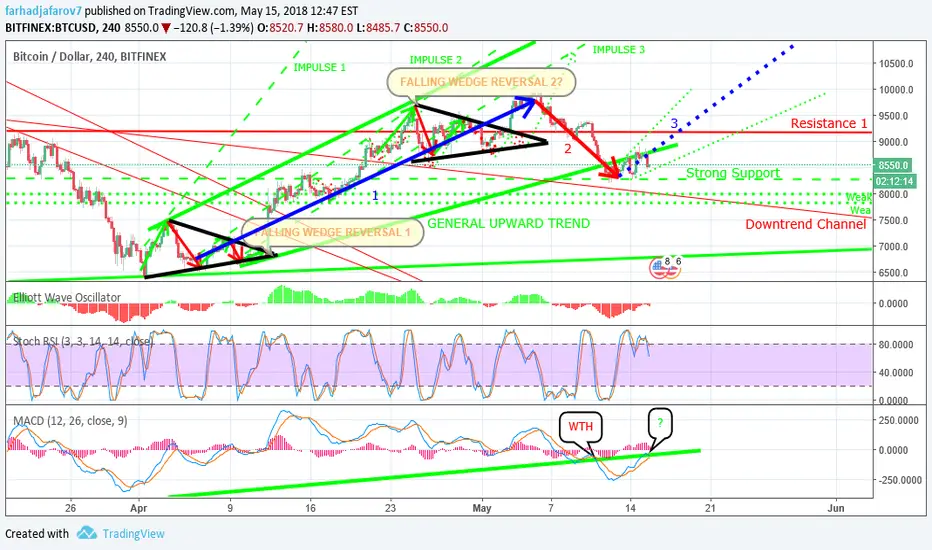
So one of the bad news for the past few days is that Bitcoin has left our trend of MACD Compression (look at previous charts for explanation of this trend) however it looks like it is going back again.
When I started looking at the general trend since the correction was over and we were on a Bull run, Bitcoin has really been going up only and the correction we are experiencing for the past days may just be the retracement, wave 2 that we are experiencing which is normal, and if to follow this trend then wave 2 seems to be over and Bitcoin has found its support at the price range of 9400-9500 USD. So, as everyone says we should see the market and the leader of the market Bitcoin going up after the consensus so till the consensus finishes the price will be volatile till it finishes but if the market will be going up after the 4th annual consensus then we might be seeing wave 3 of the bull run.
In the 4h chart the Stoch RSI, MACD and other indicators might be showing a bear move however take a look at the 1D chart which shows more trends for long term and with Bitcoin we should be thinking about what the long term trend will look like and in the 1D chart we can see the same indicators showing opposite so long term I am staying bullish so this may be a price to re-buy/buy more and I think we should shortly see the wave 3 starting however this is a decisive moment and during the next week Bitcoin should decide on its next move.
Good Luck, Traders!
Note
SORRY THE SUPPORT WAS MEANT AT 8400-8500 USD, TECHNICAL ERROR!THAT IS STILL A WEAK SUPPORT REAL STRONG SUPPORT IS AT 8200 USD PRICE RANGE!
Disclaimer
The information and publications are not meant to be, and do not constitute, financial, investment, trading, or other types of advice or recommendations supplied or endorsed by TradingView. Read more in the Terms of Use.
Disclaimer
The information and publications are not meant to be, and do not constitute, financial, investment, trading, or other types of advice or recommendations supplied or endorsed by TradingView. Read more in the Terms of Use.