Good morning all and happy Friday!
Leave a like and comment!
I wish good fortune for everyone!
Looking at the 4H chart, price has been grinding down after the major drop. We are getting lower levels of volume, and negative momentum with a higher low in RSI. These indicators are pointing to at least a short term reversal to the $8,700 level. There is always a possibility that price breaks down one more time to complete the down sloping channel, and taking a closer look with MACD could most likely show a drop with no negative momentum at all.

15 minute chart. There is a possibility that BTC is getting ready for another drop. There is a bullish divergence happening with the RSI and MACD on this time scale as well as the 1 and 4H. Down sloping consolidation after a move down with less negative momentum warrants a reversal. However before this could happen, the channel will need to play out with one more touch point on the bottom.

1H chart bullish divergence with oscillators. Since we have the potential reversal signals on multiple timeframes, it might be enough for an early break of this down channel.

1D chart for 2018's falling triangle price action that followed the break to the downside. A strong move down followed by 4 days of consolidation that seemed to be down sloping with less sell volume. An even larger spike followed the sideways movement which led into the bottoming period.

1D chart of the current situation. We've had our break to the downside with less volume on the consolidation. We might see the final day as an up day only to be followed by a spike in selling interest. What follows would be an extended phase brought by the bottoming structure.
Now of course the circumstances are quite different for the 2018 break and this one, However we just not ignore the similarities.
These are only my thoughts and opinions!
Let me know yours in the comments!
Leave a like and comment!
I wish good fortune for everyone!
Looking at the 4H chart, price has been grinding down after the major drop. We are getting lower levels of volume, and negative momentum with a higher low in RSI. These indicators are pointing to at least a short term reversal to the $8,700 level. There is always a possibility that price breaks down one more time to complete the down sloping channel, and taking a closer look with MACD could most likely show a drop with no negative momentum at all.
15 minute chart. There is a possibility that BTC is getting ready for another drop. There is a bullish divergence happening with the RSI and MACD on this time scale as well as the 1 and 4H. Down sloping consolidation after a move down with less negative momentum warrants a reversal. However before this could happen, the channel will need to play out with one more touch point on the bottom.
1H chart bullish divergence with oscillators. Since we have the potential reversal signals on multiple timeframes, it might be enough for an early break of this down channel.
1D chart for 2018's falling triangle price action that followed the break to the downside. A strong move down followed by 4 days of consolidation that seemed to be down sloping with less sell volume. An even larger spike followed the sideways movement which led into the bottoming period.
1D chart of the current situation. We've had our break to the downside with less volume on the consolidation. We might see the final day as an up day only to be followed by a spike in selling interest. What follows would be an extended phase brought by the bottoming structure.
Now of course the circumstances are quite different for the 2018 break and this one, However we just not ignore the similarities.
These are only my thoughts and opinions!
Let me know yours in the comments!
Note
BTC reaching pivotal area. A break up could bring price to $8,400 after a retest. A rejection will bring price to the lower line support near $7,400
Note
BTC attempting to break up
Note
Price broke the 200 EMA on the 15 minute with the measured move off the symmetrical triangle. The ultimate target of the descending channel/wedge on the larger timescale would be close to $8,800.
Note
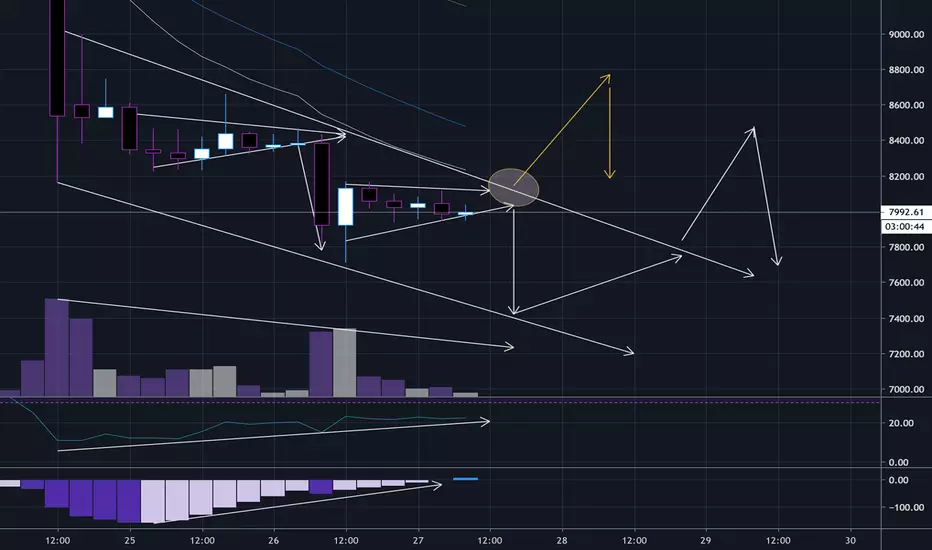
I have mapped out here the likely moves coming based on current price action.
Note
The star represents the 9k level that needs to be broken but can have a heavy rejected from. The circles represent the touch points on a possible rising channel leading to the upper targets from the falling structure break out . The gold line is the crucial support that needs to hold which is currently the 55 EMA on the 1H chart.Note
Bull flag developing
Note
The bull flag failed to break out and is now over support.
Note
The structure is now broadening, crucial decision area,
Note
Showing support currently.
Disclaimer
The information and publications are not meant to be, and do not constitute, financial, investment, trading, or other types of advice or recommendations supplied or endorsed by TradingView. Read more in the Terms of Use.
Disclaimer
The information and publications are not meant to be, and do not constitute, financial, investment, trading, or other types of advice or recommendations supplied or endorsed by TradingView. Read more in the Terms of Use.